
TL;DR: I built Ravenhold for the WeMakeDevs × FalkorDB Graph Hacks hackathon. It is a team of three AI agents that respond to production incidents. Their context, memory and coordination all live in one FalkorDB graph. When thirteen alarms go off at 2 AM, Ravenhold finds the one part that actually broke, ignores the noise, finds the person who fixed this exact problem before (even though they’ve changed teams), and pulls up the written-down fix. You approve the page before anyone is woken up.
-
🔗 Live demo: https://ravenhold.onrender.com (free to try, with your own private copy of the graph)
-
🎬 Demo video: https://youtu.be/gQek1boZHDk (the working demo, start to finish)
-
🏆 Built for all three Graph Hacks tracks at once: Agents That Act on Connected Data, Agent Memory and Coordination, and Company Brain
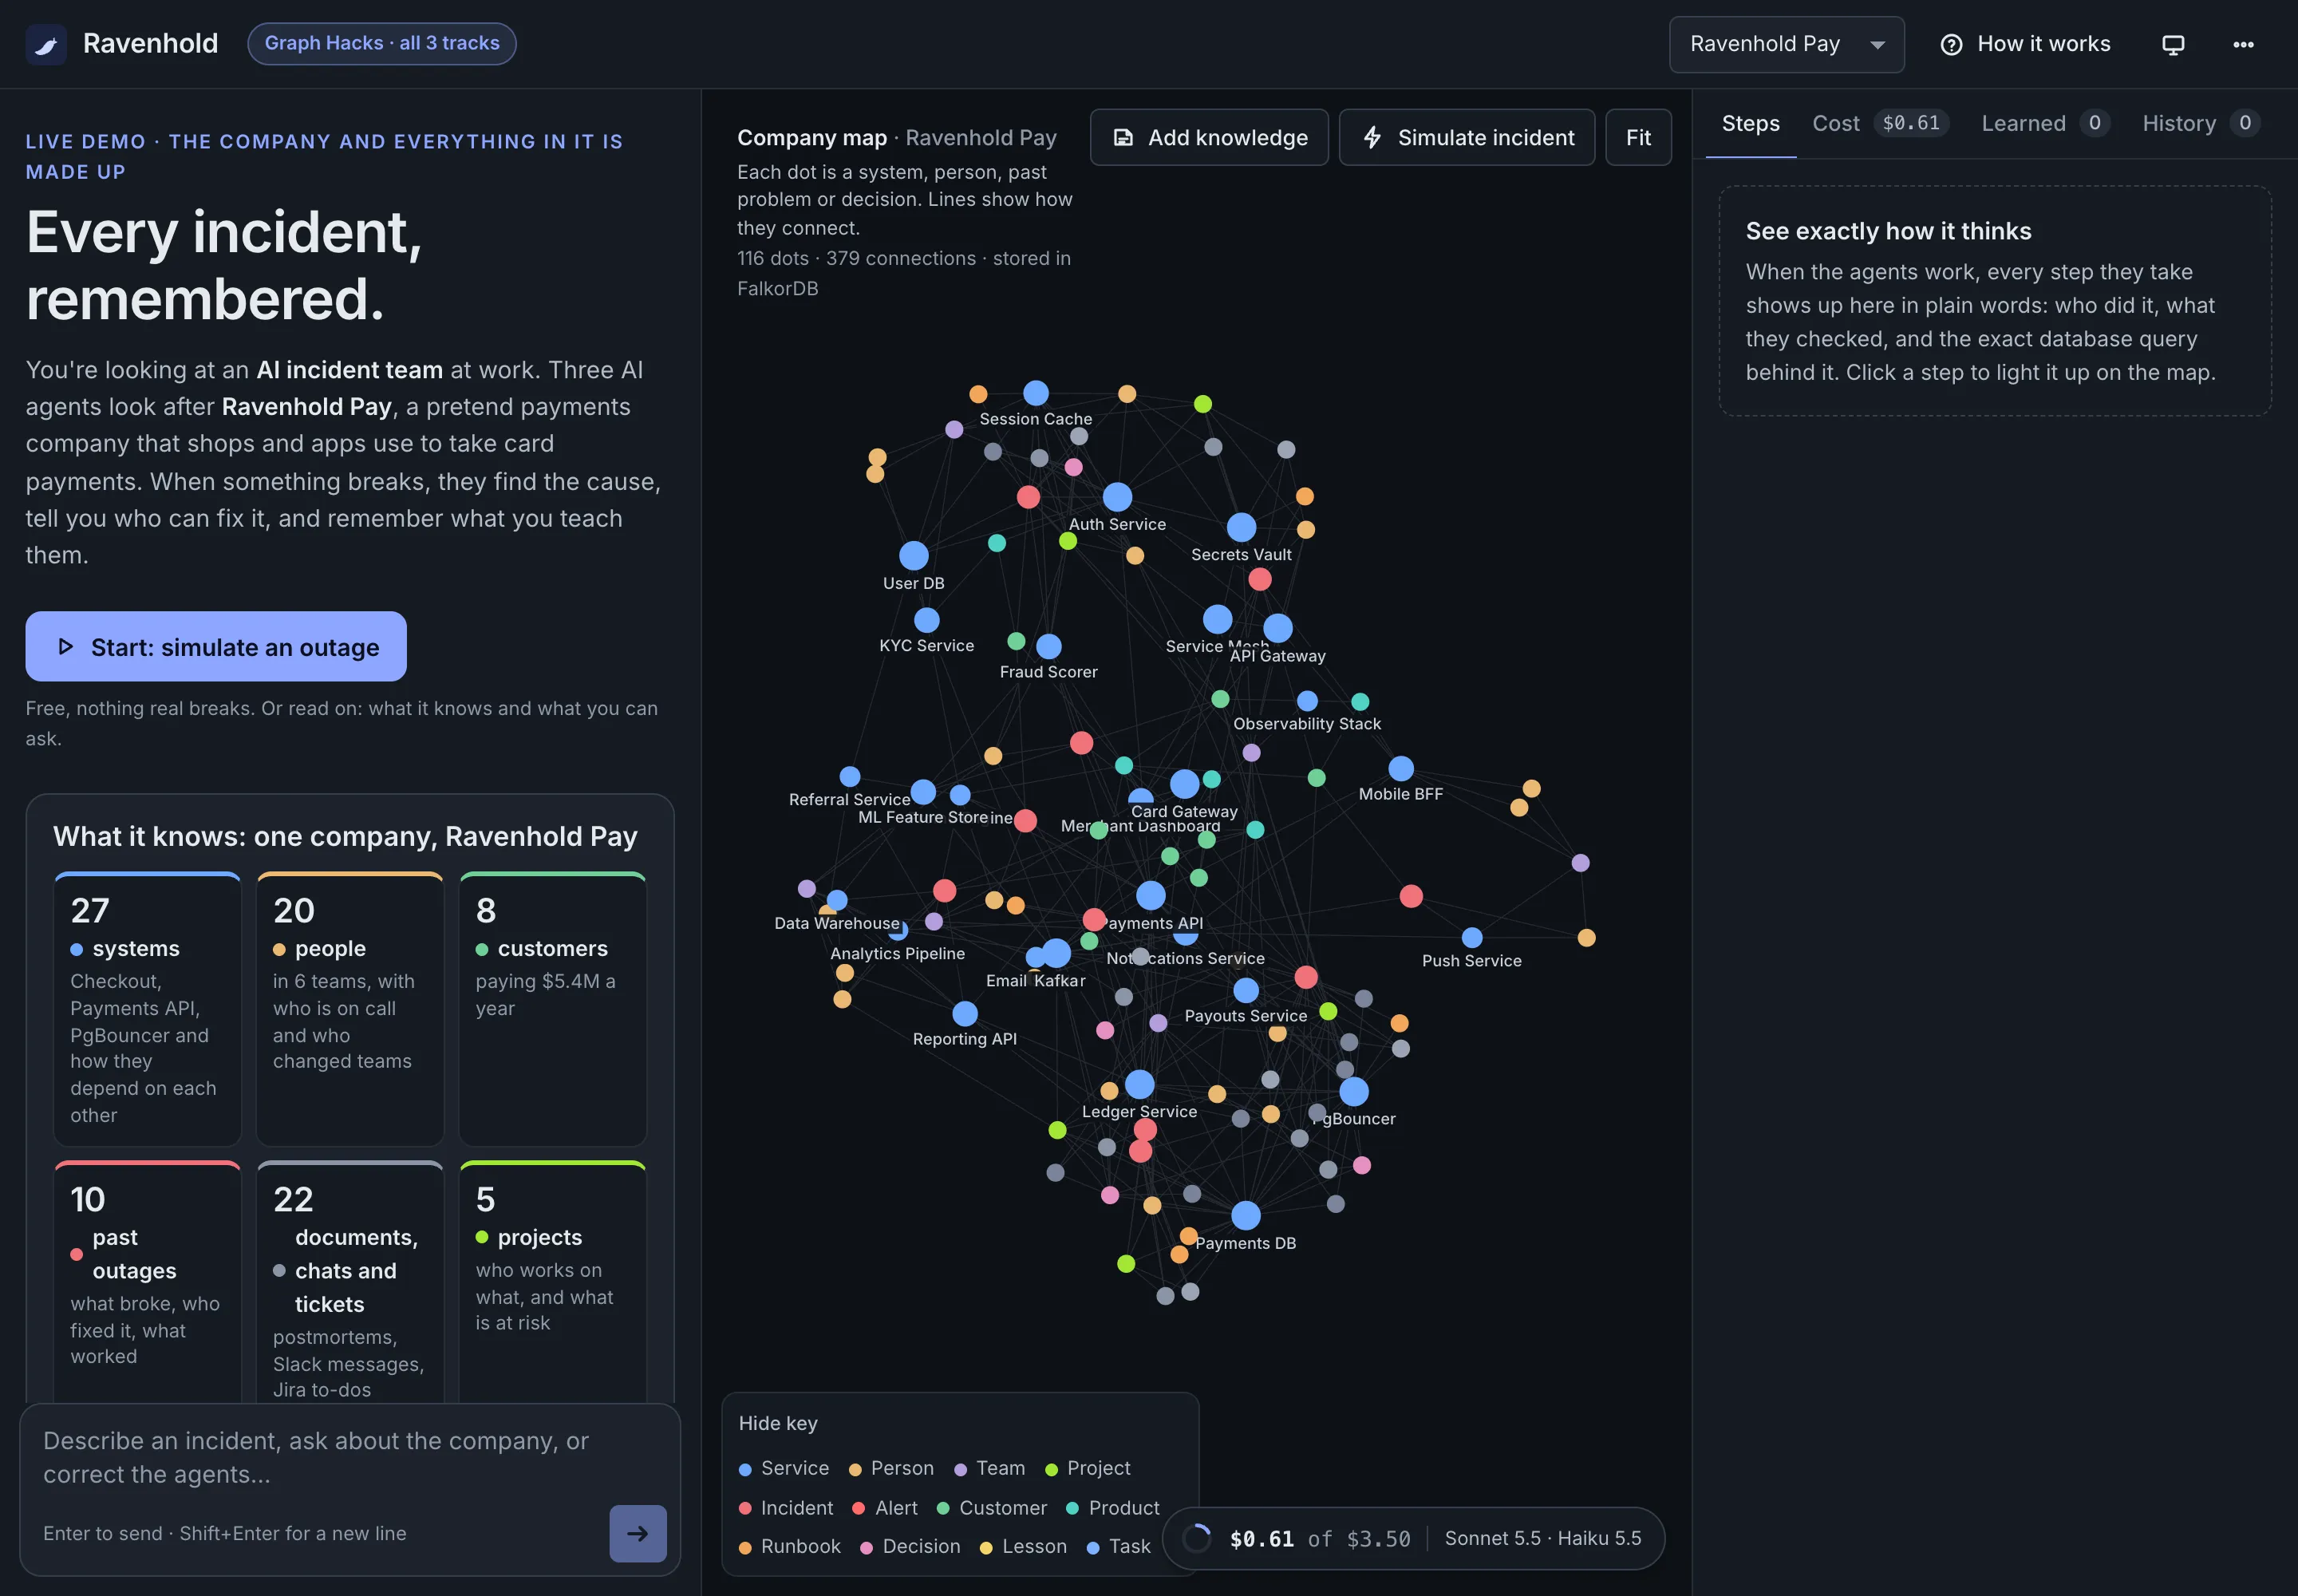 The live site. The start screen explains what the demo is, shows exactly what the agents know (counted live from the map, in the map’s colours), and walks you through three steps to try it; the company map (stored in FalkorDB) is in the middle, and every step the agents take appears on the right. All screenshots in this post are from the live demo; all data is synthetic.
Overview
Ravenhold at a glance:
- It’s a team of three AI agents that handles IT outages, working for a company we invented: Ravenhold Pay, a fictional payments business that shops and apps use to take card payments. You play the engineer on call.
- The agents aren’t trained on the company. They are general Claude models that know nothing about Ravenhold Pay. Every fact they use is looked up, each time, in a map of the company stored in FalkorDB: 27 systems, 20 people in 6 teams, 8 customers, 10 past outages, 22 documents, chats and tickets, 6 written-down fixes, 4 decisions and 5 projects. All of it is hand-written and made up.
- You can ask what is broken and who can fix it, what breaks if a system fails, who really knows a system, what a team is working on, why something was built a certain way, and which systems are the riskiest.
- They act, but you decide. They open incidents and draft pages and runbook changes; nothing that matters happens until you click Approve.
- They remember what you teach them. A correction is saved in the map and used in every future conversation.
- They can’t answer anything outside Ravenhold Pay, see live systems, really call anyone, or learn on their own.
Every action the agents take is described in a Steps panel, with the exact database query underneath, so you never have to take an answer on trust.
The problem: the knowledge exists, it’s just scattered
Here’s a story every on-call engineer knows.
It’s 2 AM and checkout is down. Thirteen alarms fire across ten systems. Marcus is on call and has never touched any of them. He spends 40 minutes asking around in chat. Eventually someone remembers that Sarah fixed something like this in March, but Sarah moved to another team, so nobody thought to call her. When she finally joins, she says: “Don’t restart the database, that didn’t help last time. The fix is already written down.” It was, in a doc nobody found.
None of this information was missing. It was spread across Slack, Jira, GitHub, the alerting tool and old docs, and nobody could connect the dots fast enough. Connecting dots is exactly what a graph is for.
Results
Before the details, the numbers. Everything below was measured on 2026-10-18 against the published code: FalkorDB 4.22.1,
Claude Sonnet 5.5 as the Commander and Claude Haiku 5.5 as the workers, every graph tool call over MCP. Each agent run
gets a fresh copy of the company graph, and answers are scored against ground truth computed from the graph, never
against what the model claims. The raw outputs are in the repo under docs/eval/.
| What was measured | Result |
|---|---|
| Alert-storm triage, 3 storms × 3 runs: right root cause / right person paged / unrelated alarm flagged | 9/9 · 9/9 · 9/9, 100% of cited ids real |
| Impact: every affected customer named | 2/2 (8 of 8 customers) |
| Memory across sessions: a correction is used in a brand-new conversation, cited, and flagged as remembered; both worker handoffs complete | 2/2 (all 7 sub-checks) |
| Company brain: projects, experts, decision sources | 6/6 |
| Pasted updates applied exactly, including one message with no facts | 9/9 |
| Closed loop: right fix proposed on the root service, applied with approval, recovery verified | 3/3 storms |
| UI preset questions taking the documented tool path | 7/7 |
| 100 conversations at once across 5 private graphs | 1,600 graph operations in 3.0 s, 0 failures, 0 duplicates, 0 leaks |
| Generated company with 20,000 services | every agent tool under 1 s |
| Deterministic tests | 32/32 |
Two honest caveats: the samples are small (2 to 9 runs per agent check), so these mean “passed every time we ran it”, not a precise accuracy rate; and these suites found six real defects along the way, all fixed and described in Things that bit me.
Built for all three tracks at once
Graph Hacks lets you build for one track or for all three at once. Ravenhold is one agent team on one graph, entered in all three:
| Track | What it asks for | How Ravenhold answers it | Where in this post |
|---|---|---|---|
| 🕵️ Agents That Act on Connected Data | An agent that uses the graph to decide and act | Multi-hop walks from alarms to the one root cause and to the customers at risk; graph algorithms as tools; the agents pick their tools through MCP; they open incidents and ask to page the right person; every step shows its Cypher | One incident, start to finish, The agents pick their tools through MCP, Showing its work |
| 🤖 Agent Memory and Coordination | Agents that remember across sessions and share state | Episodic, semantic and procedural memory (Episodes, Lessons, versioned runbooks you approve); handoffs through Task nodes you can watch; 100 conversations at once with no duplicates; a private graph per visitor | Three agents, one graph, Memory that you can approve, Does it actually work? |
| 🧠 Company Brain | An agent that understands how a company works and gets work done | People, teams, projects, docs, chats, tickets and decisions in one graph; who owns vs who actually knows; decisions traced to their sources; knowledge kept current from pasted text, with sources | Who is working on what, Keeping the company brain current |
How it works at a glance
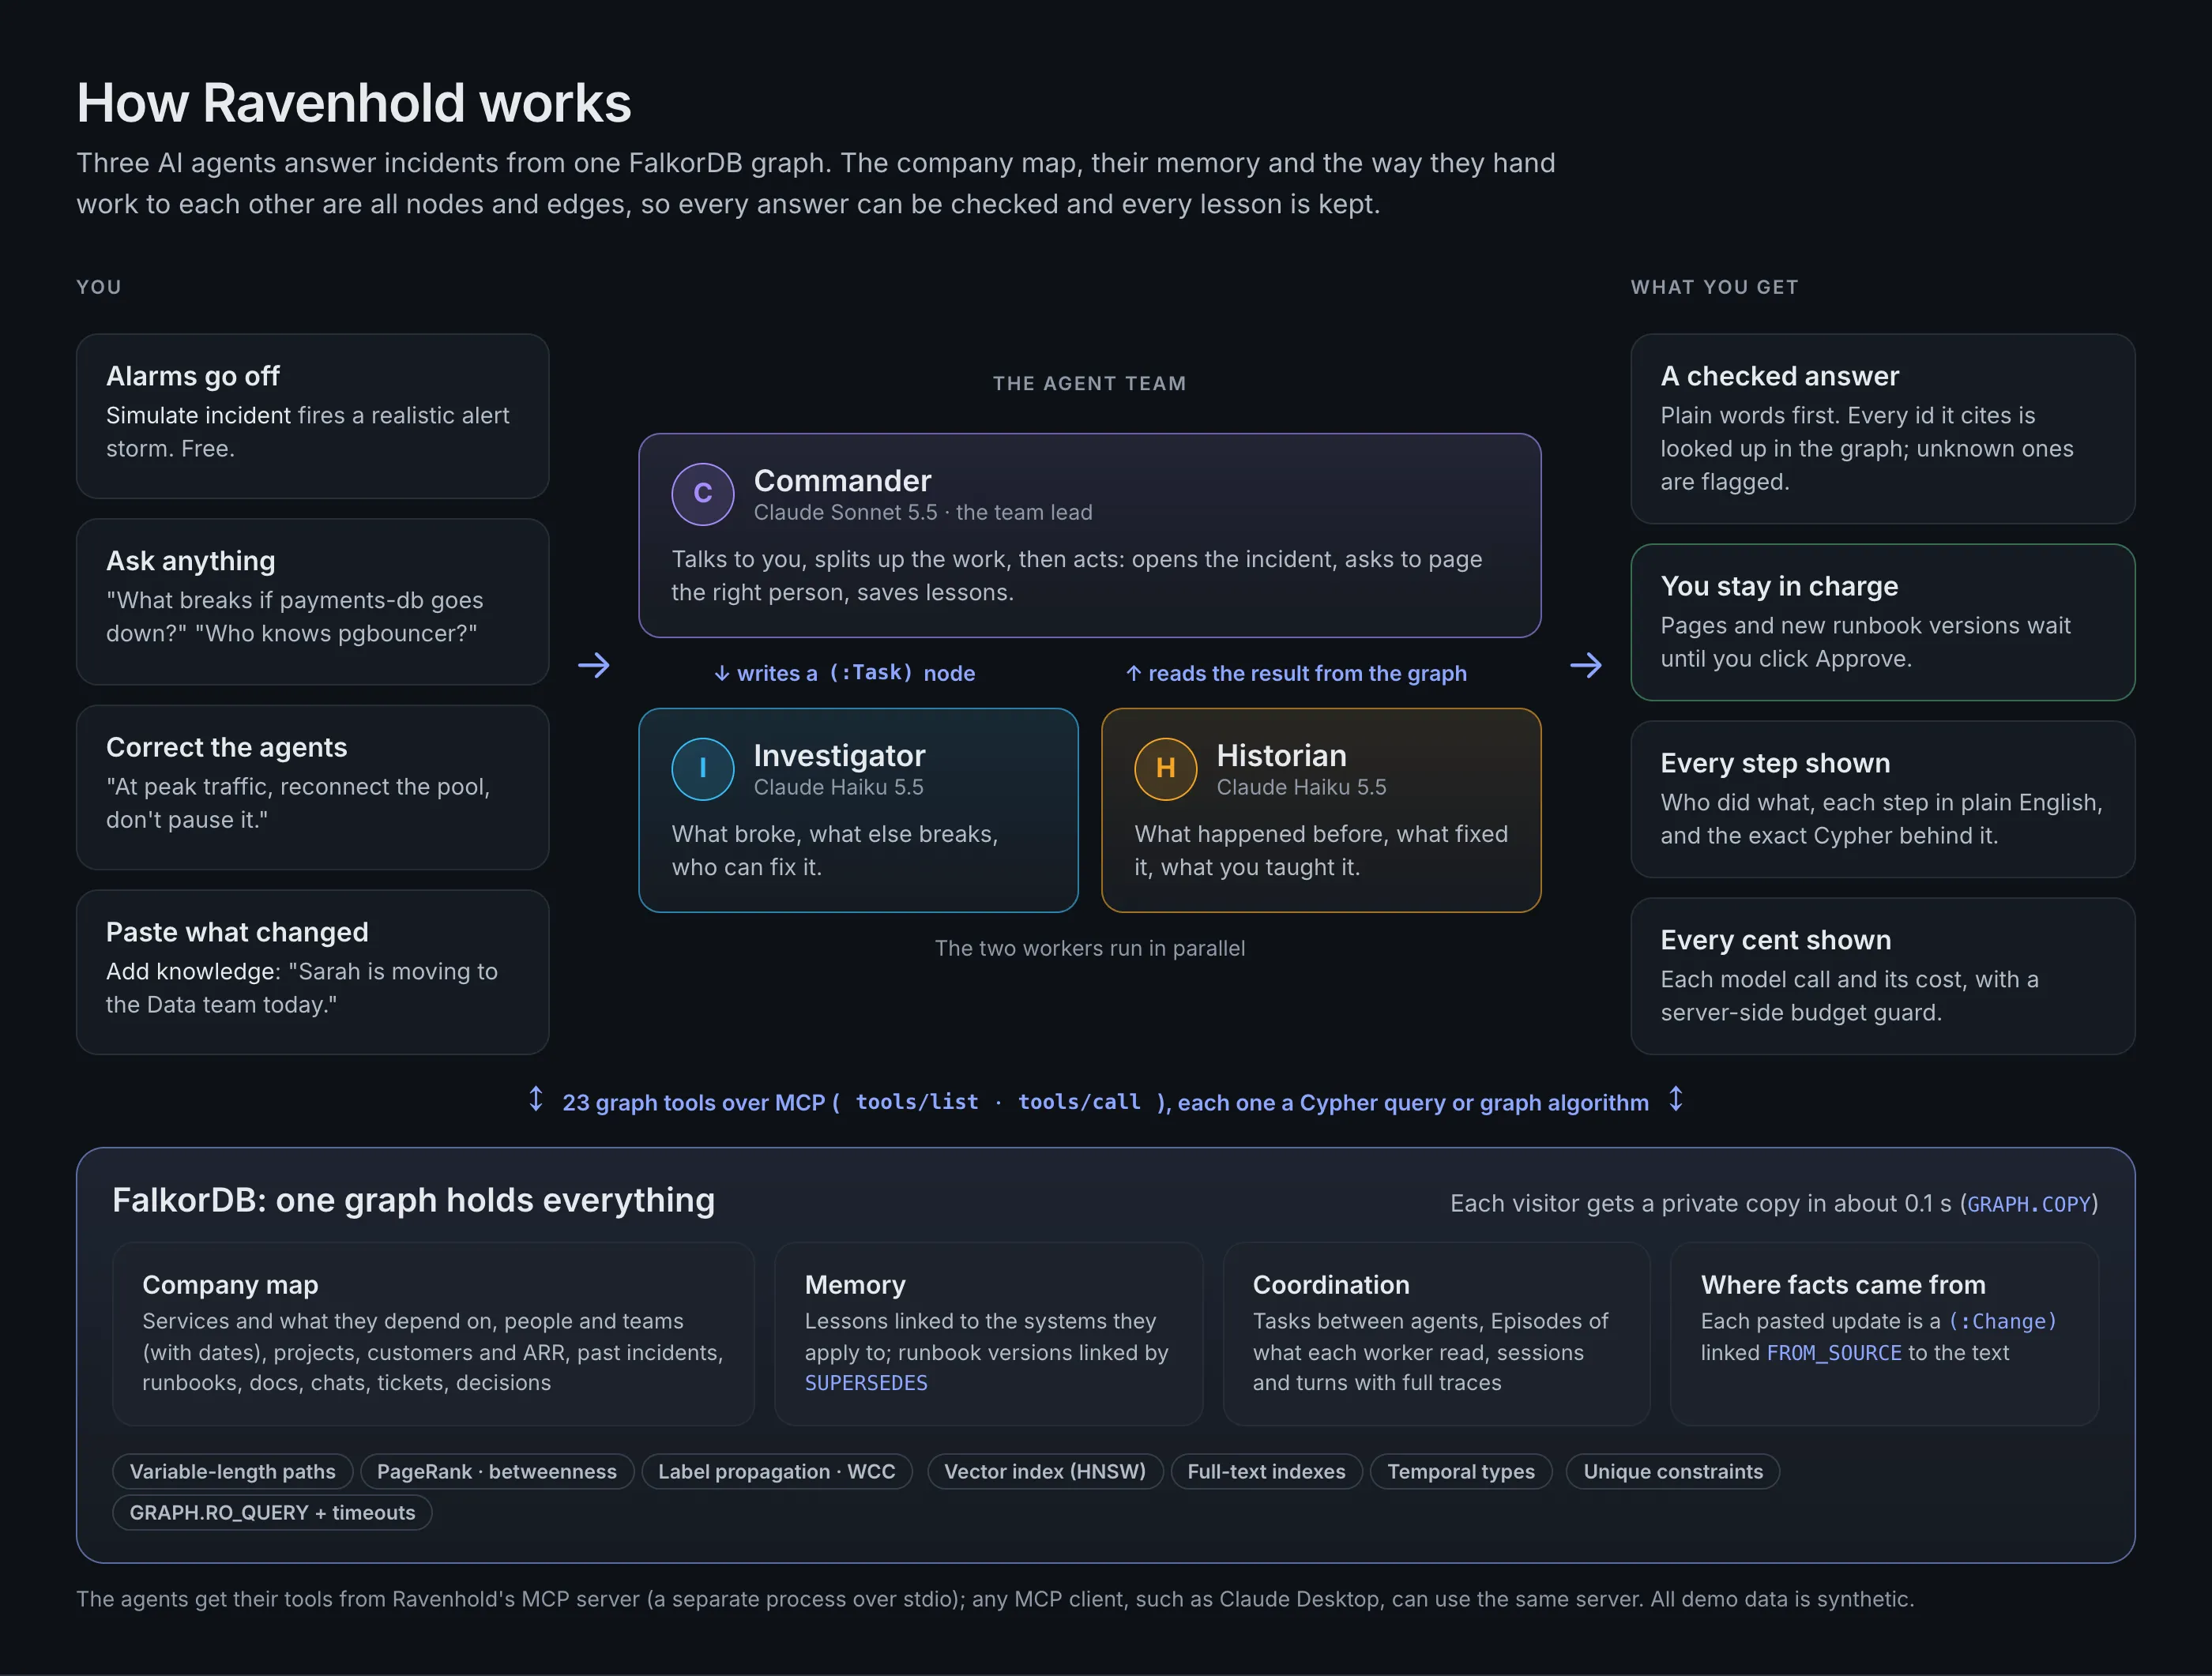 You bring alarms, questions, corrections and updates. The Commander splits the work, the Investigator and Historian run in parallel, and everything they read, remember and hand to each other lives in one FalkorDB graph.
The rest of this post zooms in on each part of this picture.
Why a graph and not a vector store?
The questions an incident commander asks are about relationships, not similar-looking text:
- If PgBouncer is down, what else breaks, and which customers pay for those products? That’s a multi-hop walk.
- Who actually knows this system? That means people who RESOLVED incidents on it or CONTRIBUTED_TO it, which is not the same as the team that OWNS it.
- Why was it built this way? That means following a Decision back to the chats and docs it was DERIVED_FROM.
Embeddings can find a paragraph that sounds similar. They can’t tell you that Sarah left the Platform team six months ago and is still the best person to call. A graph answers that in one query.
The graph model
The demo company, Ravenhold Pay, is fully synthetic. It has 27 services, 20 people in 6 teams, 8 customers, 10 past incidents, 7 docs, 9 chat messages, 6 tickets, 6 runbooks and 4 decisions.
(:Customer)-[:USES]->(:Product)<-[:POWERS]-(:Service)-[:DEPENDS_ON]->(:Service)
(:Team)-[:OWNS]->(:Service)      (:Person)-[:MEMBER_OF {from, to}]->(:Team)
(:Person)-[:ON_CALL_FOR]->(:Team) (:Person)-[:CONTRIBUTED_TO {commits}]->(:Service)
(:Incident)-[:ROOT_CAUSE|AFFECTED]->(:Service)   (:Person)-[:RESOLVED]->(:Incident)
(:Incident)-[:FIXED_WITH]->(:Runbook)            (:Runbook)-[:SUPERSEDES]->(:Runbook)
(:Decision)-[:DERIVED_FROM]->(:Source)           (:Lesson)-[:APPLIES_TO]->(:Service)
Team membership has from/to dates, so history isn’t overwritten. That is how Ravenhold knows Sarah used to be
on Platform.
For people who don’t read Cypher, the in-app How it works guide draws a real slice of the same graph:
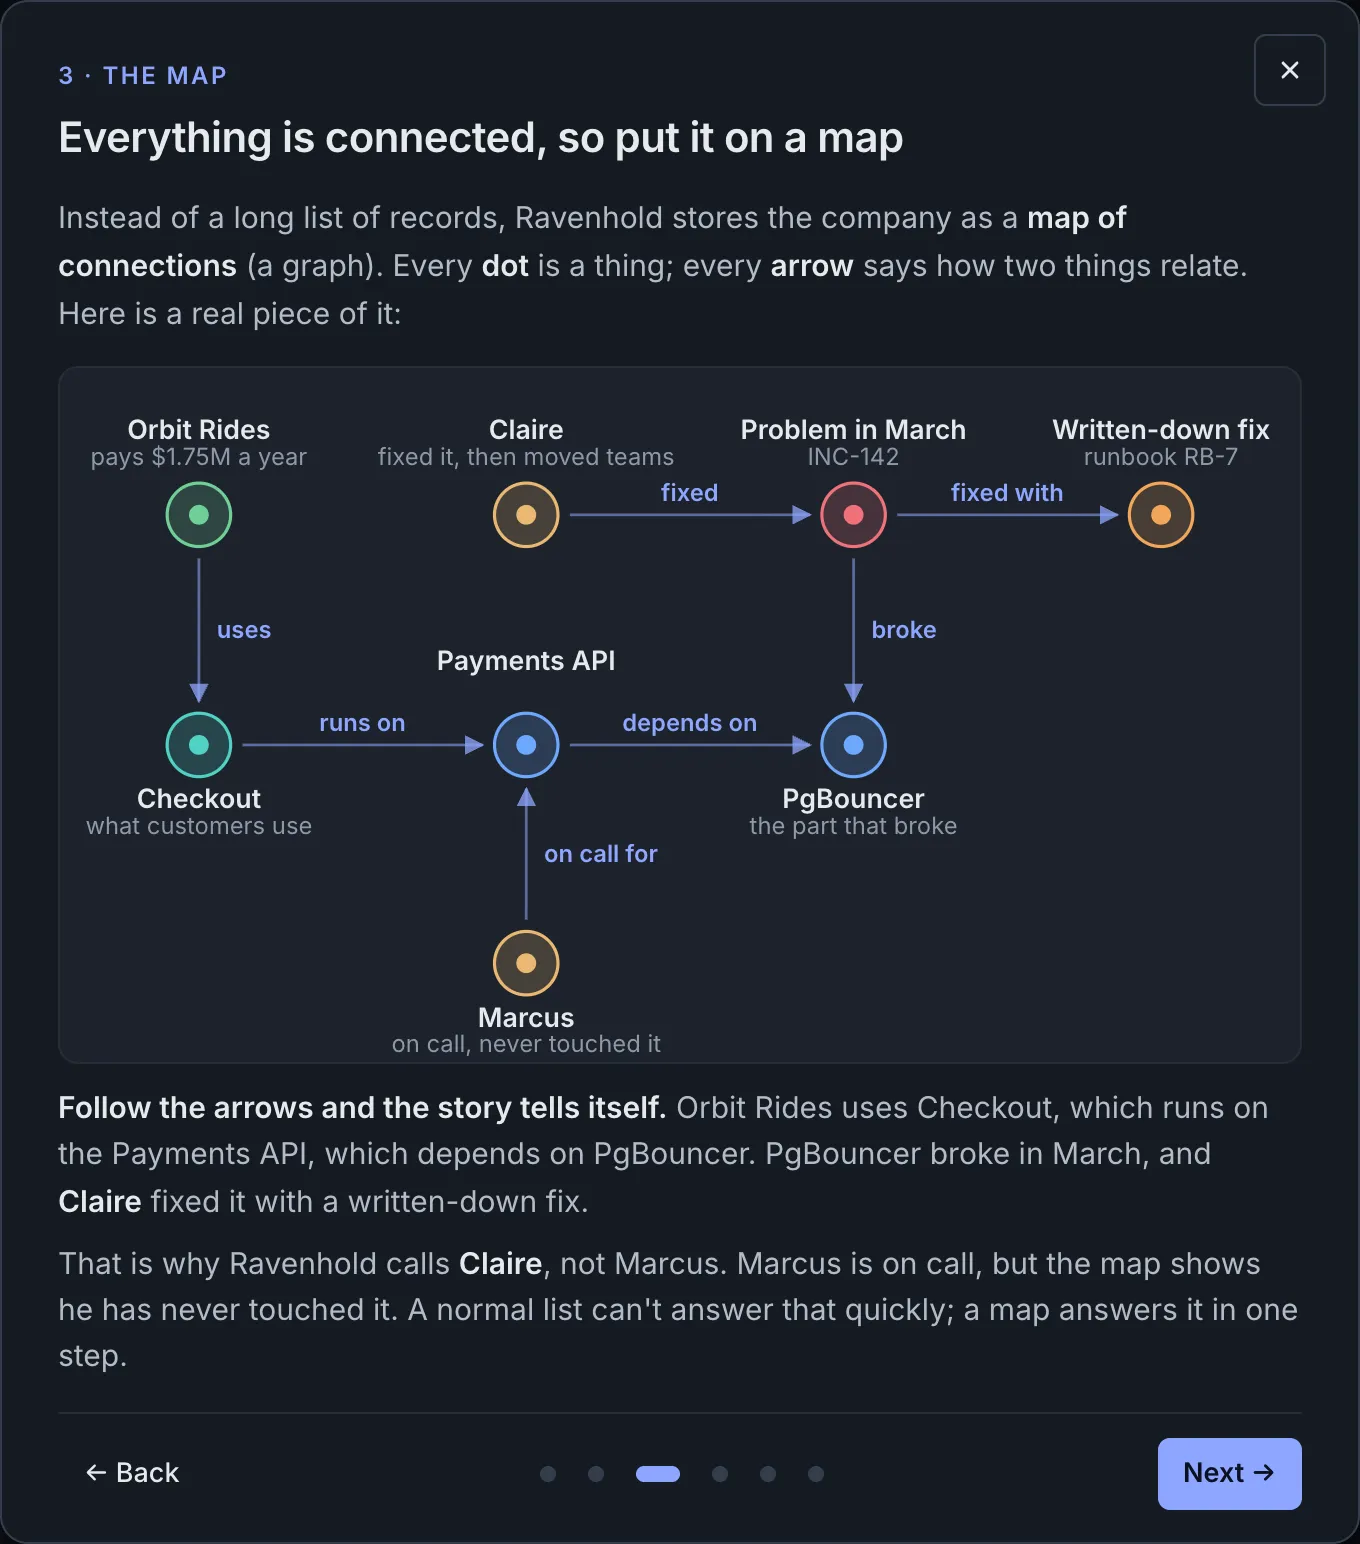 Follow the arrows and the story tells itself: the customer, the system that broke, the person who fixed it in March, and the on-call engineer who has never touched it.
Here is the core of “what breaks if this goes down”, a variable-length walk up the dependency graph:
MATCH p = (d:Service)-[:DEPENDS_ON*1..6]->(:Service {id: $id})
RETURN d.id AS id, d.name AS name, d.tier AS tier, min(length(p)) AS hops
ORDER BY hops, tier
And “who really knows this system”, which compares real experience against the official owner:
MATCH (s:Service {id: $id}), (p:Person)
OPTIONAL MATCH (p)-[c:CONTRIBUTED_TO]->(s)
OPTIONAL MATCH (p)-[:RESOLVED]->(i:Incident)-[:ROOT_CAUSE|AFFECTED]->(s)
OPTIONAL MATCH (p)-[:AUTHORED]->(d:Doc)-[:ABOUT]->(s)
WITH p, coalesce(max(c.commits), 0) AS commits, max(c.last_at) AS last_commit,
     collect(DISTINCT i.id) AS incidents, collect(DISTINCT d.id) AS docs
WHERE commits > 0 OR size(incidents) > 0 OR size(docs) > 0
OPTIONAL MATCH (p)-[m:MEMBER_OF]->(team:Team) WHERE m.to IS NULL
...
Three agents, one graph
- Commander (Claude Sonnet 5.5) talks to you, splits up the work and takes actions: it opens the incident, requests a page and files the follow-up.
- Investigator (Claude Haiku 5.5) handles root cause, blast radius and who to call.
- Historian (Claude Haiku 5.5) covers similar past incidents, runbooks and lessons learned.
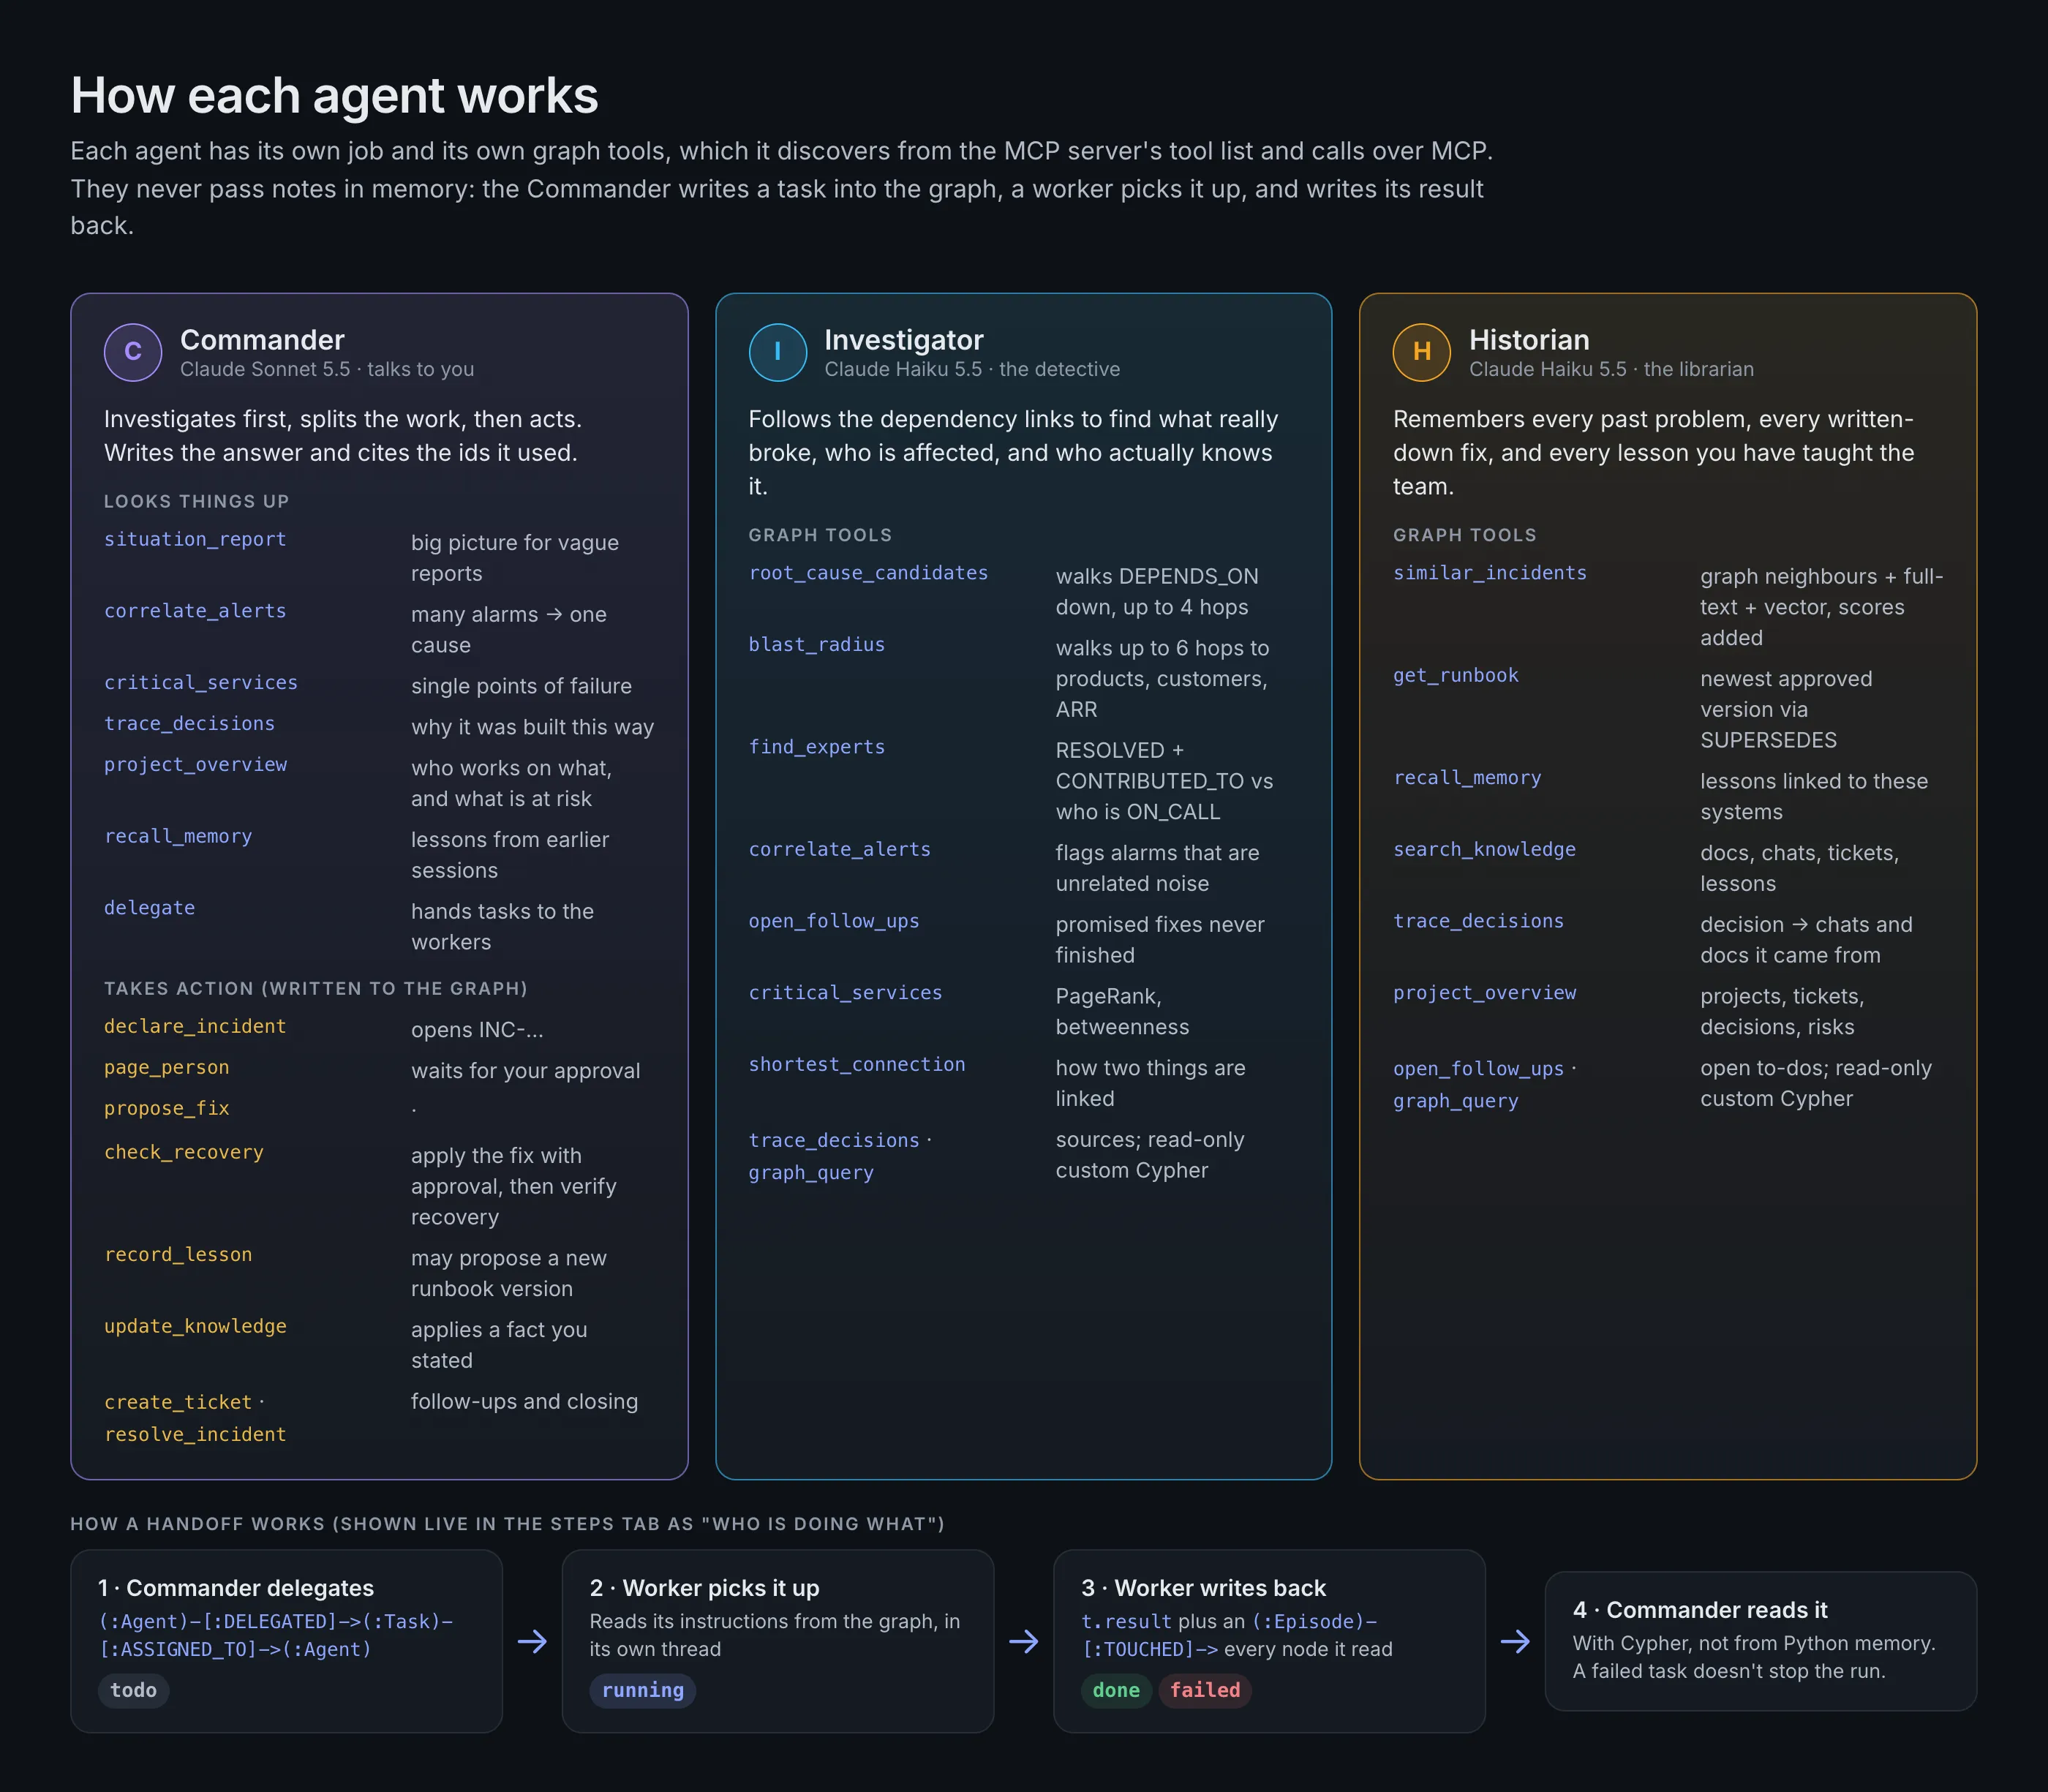 Each agent has its own job and its own graph tools. The strip at the bottom is the handoff: a Task node goes from todo to running to done (or failed), and the Commander reads the result back with Cypher.
They don’t pass messages around in a Python list. The Commander writes Task nodes into the graph, the workers run in parallel and write their results back, and every step is persisted on the conversation’s Turn nodes. Coordination is just more graph, so the whole investigation can be replayed and audited.
You can watch them hand off work
This turned out to be one of my favourite parts of the UI. While the agents work, the Steps panel shows a Who is doing what card for every job the Commander hands out.
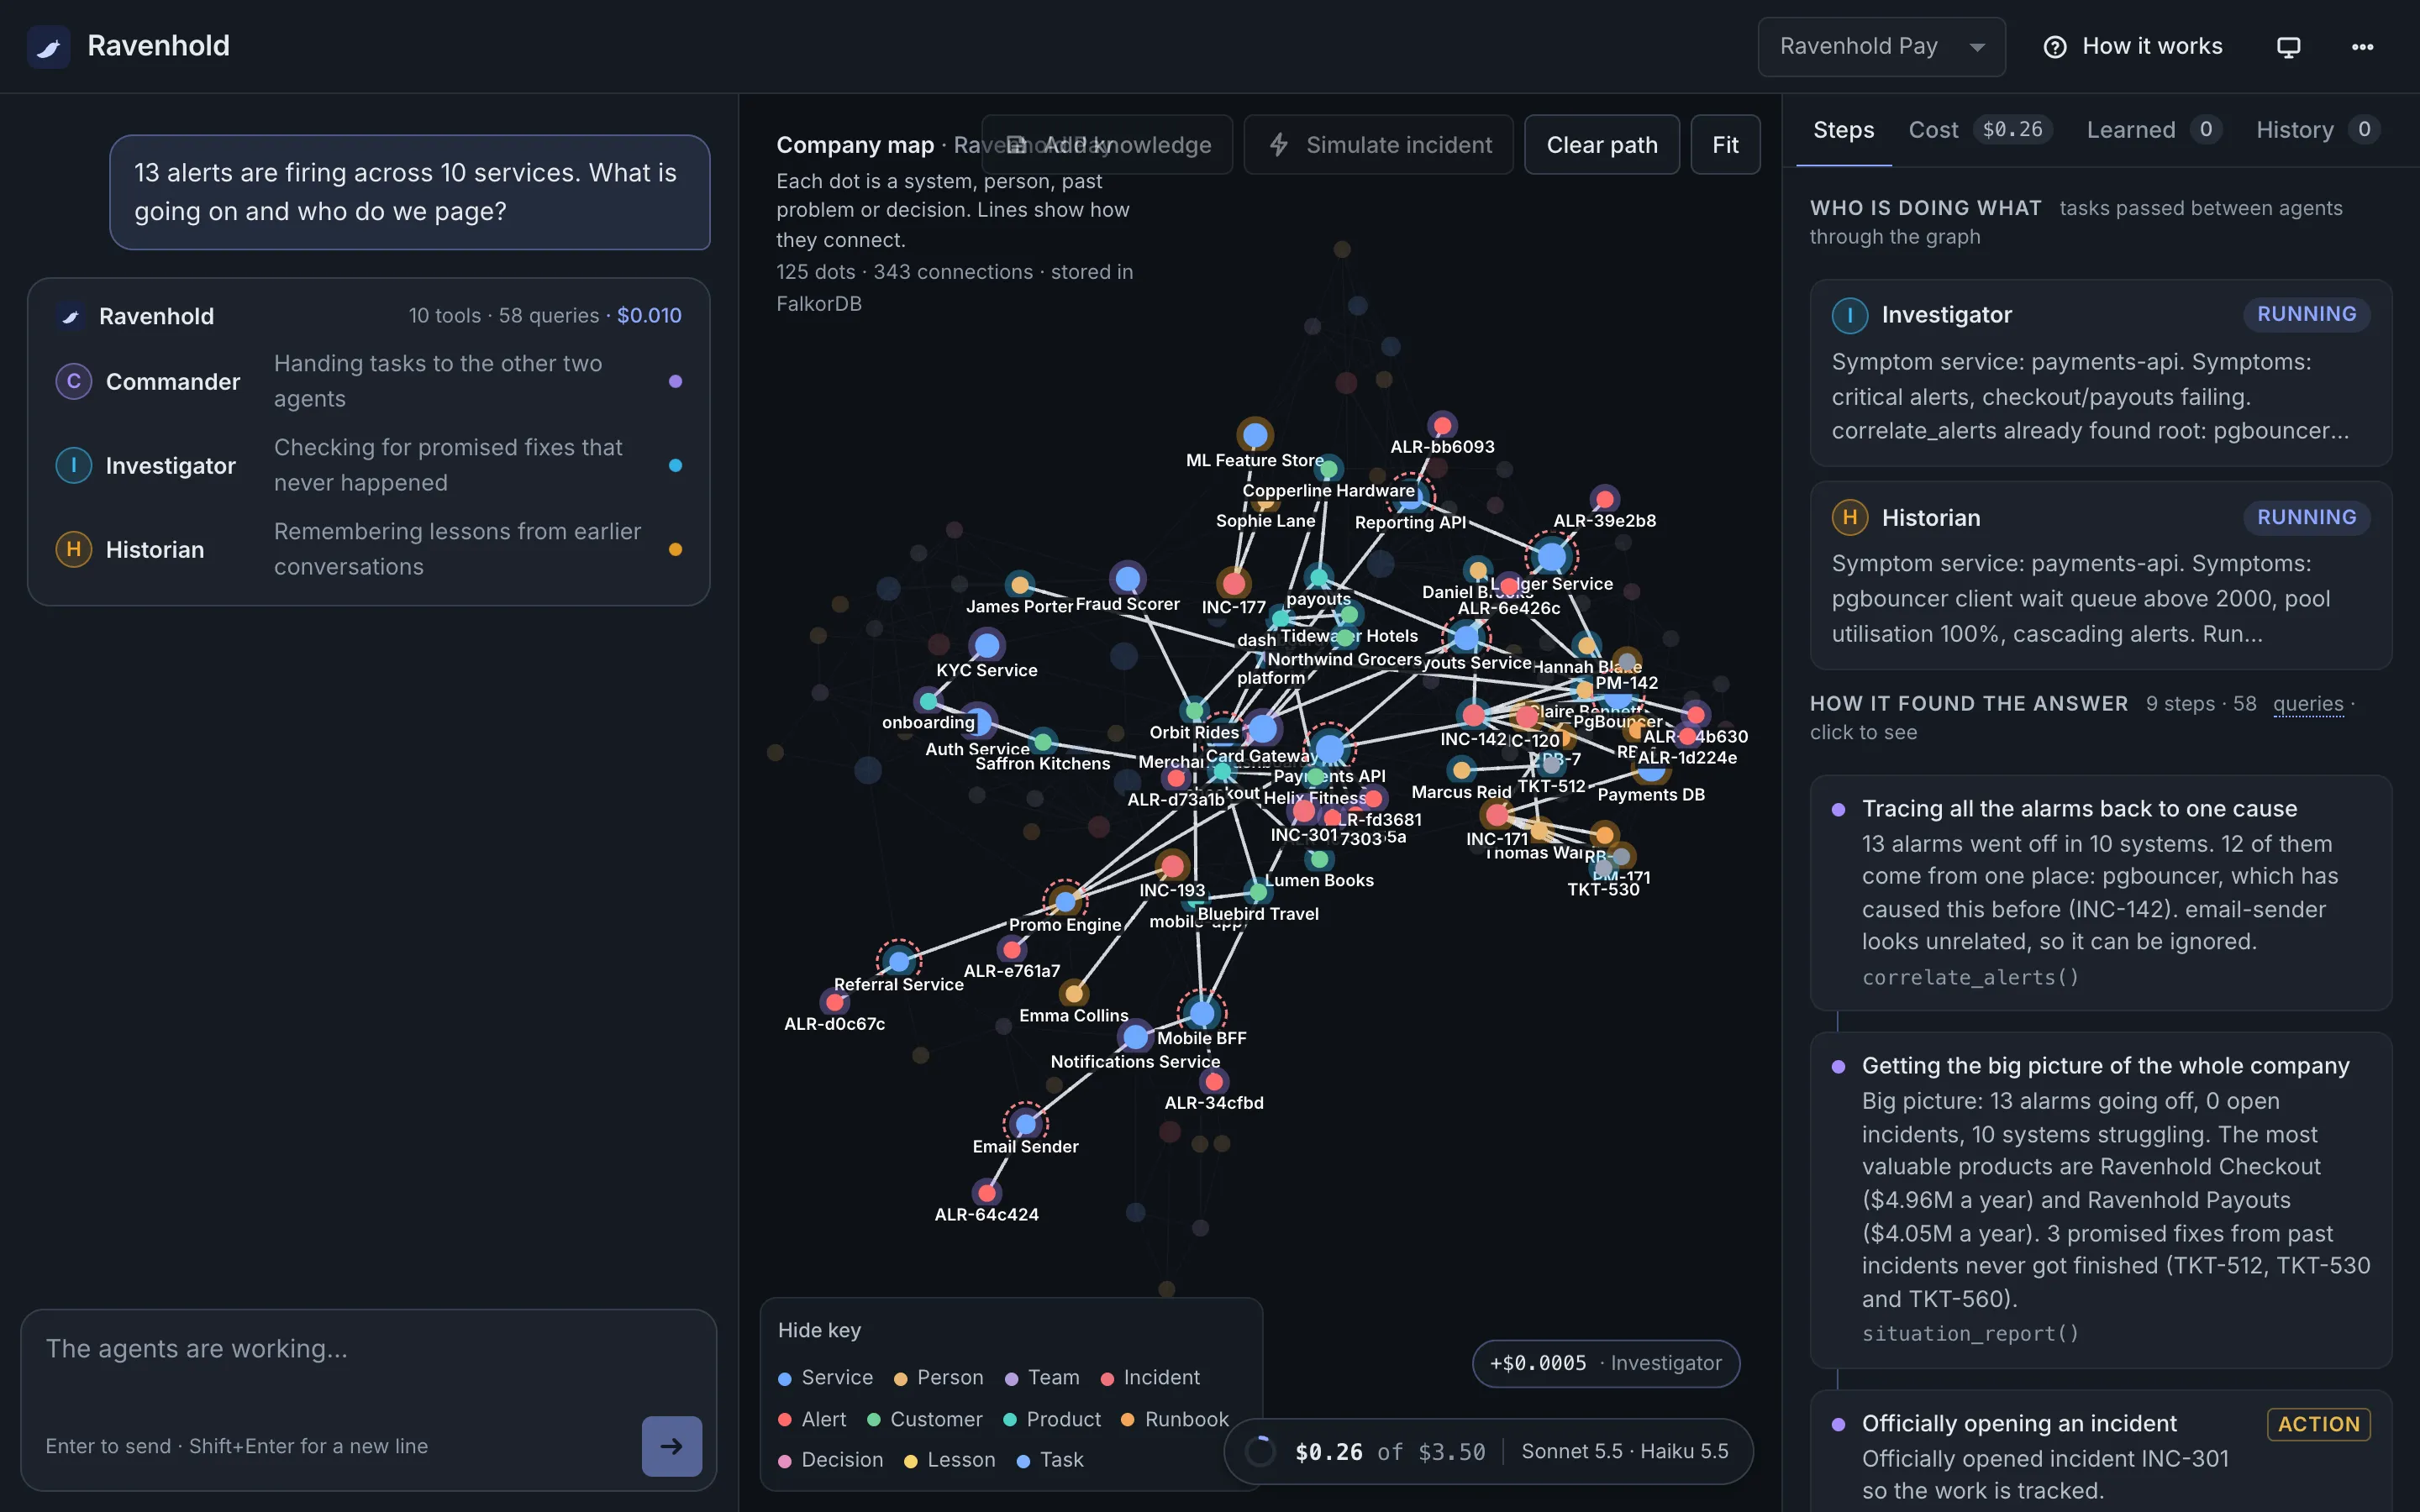 Mid-run on the live site: the chat shows what each agent is doing right now, the Steps panel shows both tasks running in parallel, and the map lights up what they touch in each agent’s colour.
Here’s a real card, from “Who actually knows pgbouncer, and are they on call?”:
Investigator ·
DONEService: pgbouncer. Run find_experts on pgbouncer (and on its top dependencies/dependents if relevant), preferring people who resolved past incidents caused by pgbouncer. Report who actually knows it (commits, past incidents resolved, current team) and who is on call for the owning team, and whether the experts are on call.How it found the answer · 3 steps · 11 queries · click to see
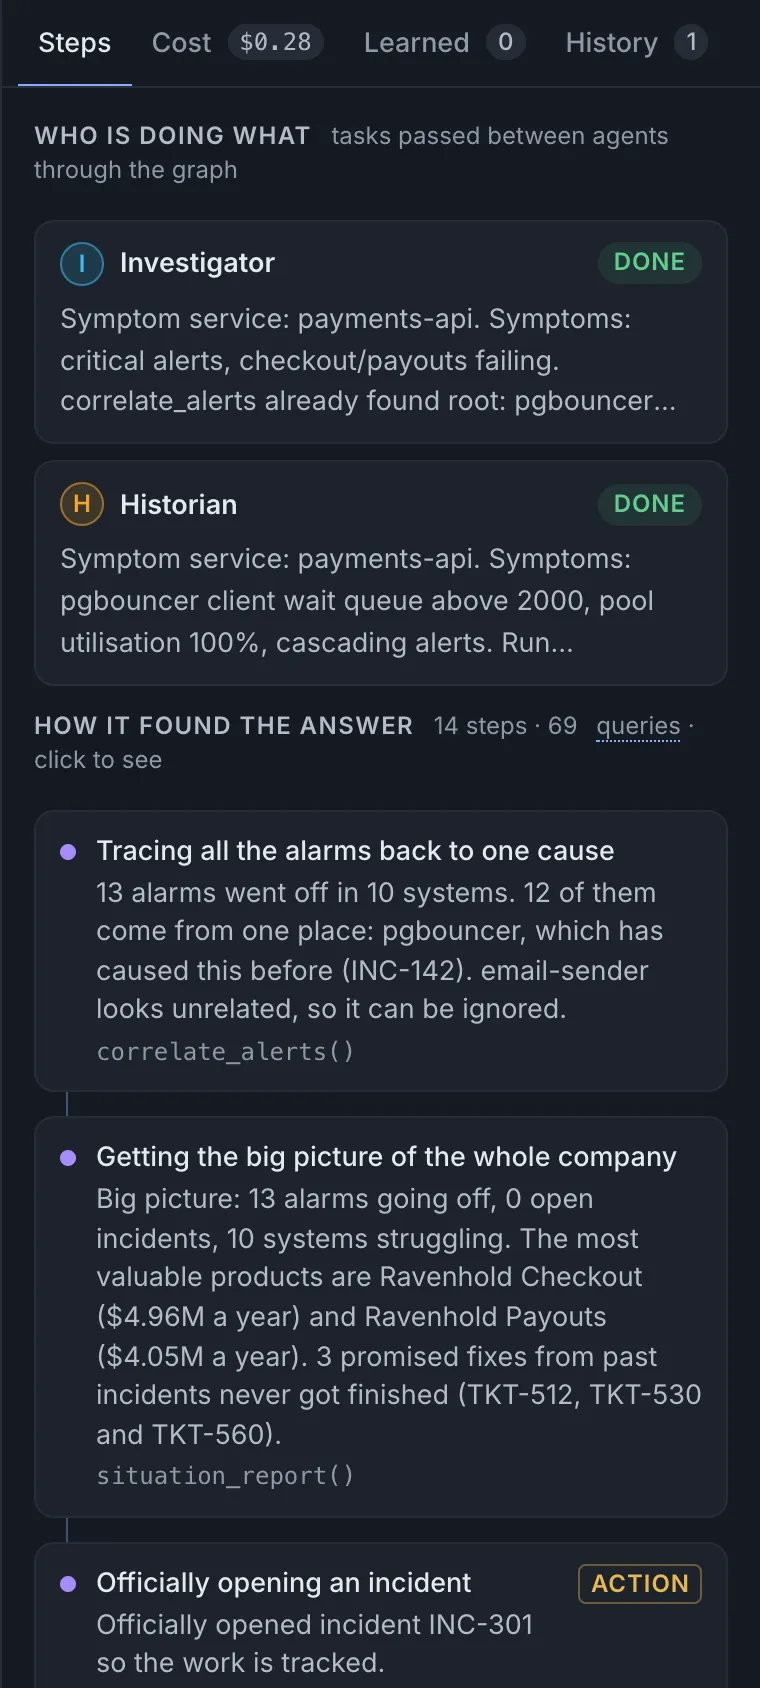 The panel once the work is done: each task with its exact instructions and status, then a one-line description of every step.
If you’re not technical, it reads like a team lead’s to-do list. You see the plan, not just the answer. You can tell whether it asked the right question: here it asked for people who have fixed pgbouncer before, not just whoever is on call, which is exactly why the answer names the right person. The status goes from todo to running to done (or failed, which is shown, never hidden). Every step underneath is one plain-English sentence, and clicking it lights up what it looked at on the map.
If you’re an engineer, the card isn’t a log line; it’s a node. delegate writes
(Commander)-[:DELEGATED]->(:Task)-[:ASSIGNED_TO]->(Investigator). The worker runs in its own thread, reads the task
from the graph, sets running, then writes the result, done or failed, and an (:Episode) that TOUCHED every
node it read. When something goes wrong, the exact instruction each worker got is right there, so I can tell a vague
task from a bad tool result. And because the handoff is data, I can audit any past run with one query:
MATCH (t:Task)-[:IN_SESSION]->(:Session {id: $sid})
MATCH (commander:Agent)-[:DELEGATED]->(t)-[:ASSIGNED_TO]->(worker:Agent)
OPTIONAL MATCH (e:Episode)-[:FOR_TASK]->(t)
OPTIONAL MATCH (e)-[:TOUCHED]->(n)
RETURN commander.id AS from, worker.id AS to, t.status AS status,
       count(DISTINCT n) AS nodes_read, t.instructions AS task
On one recorded incident it returns two tasks that ran in parallel: the Investigator read 44 nodes and the Historian 28.
The agents use 23 typed graph tools (plain Cypher behind each). One of them, graph_query, is an escape hatch
for questions no other tool covers. It runs through GRAPH.RO_QUERY with a 3-second timeout and a 100-row cap, so a model can’t write to the graph
or hang it.
The agents pick their tools through MCP
Ravenhold ships an MCP server with all 23 graph tools, so Claude Desktop or Claude Code can use them. I didn’t want
MCP to be a side door, though, so Ravenhold’s own agents use it too. When the API starts, it launches the MCP
server as a separate process and connects over stdio. The tool list each agent sees is the server’s tools/list
(filtered to its role), and every tool it chooses runs with tools/call.
The one subtle part is the workspace. Every visitor has a private graph, and the model must never choose whose
graph it touches. So the agent-facing server takes tenant and session_id on every tool, and the client
(mcp_bridge.py) strips those fields from the schemas the model sees and fills them in itself. Results come back with
their Cypher and the highlighted subgraph, so the trace in the UI is unchanged; the Steps panel just says tools via
MCP. One connection serves all three agents, and calls from the two parallel workers run concurrently: the server
runs each tool in its own thread, and 24 simultaneous calls finish in about 0.1 s locally.
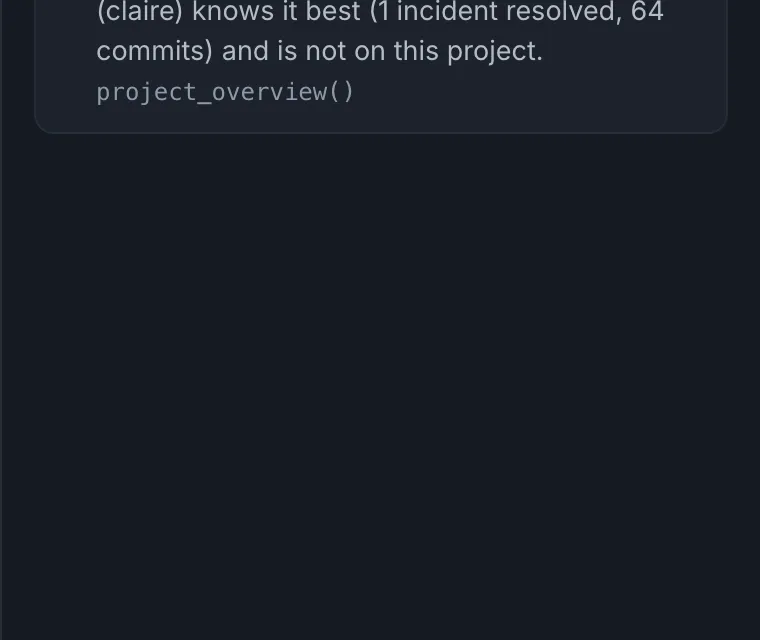 On the live site: the Commander picked project_overview from the MCP tool list, and the call ran over MCP.
Switching to MCP also caught a bug that a direct function call hid. The MCP SDK validates arguments and then passes
every parameter to the tool, defaults included, so an optional service_id="" suddenly reached the id check as an
“unknown service”. The agent-facing server now forwards only what the model actually set, and a test pins it.
One incident, start to finish
Here is the 2 AM outage from the top of this post, as it actually ran on the live site:
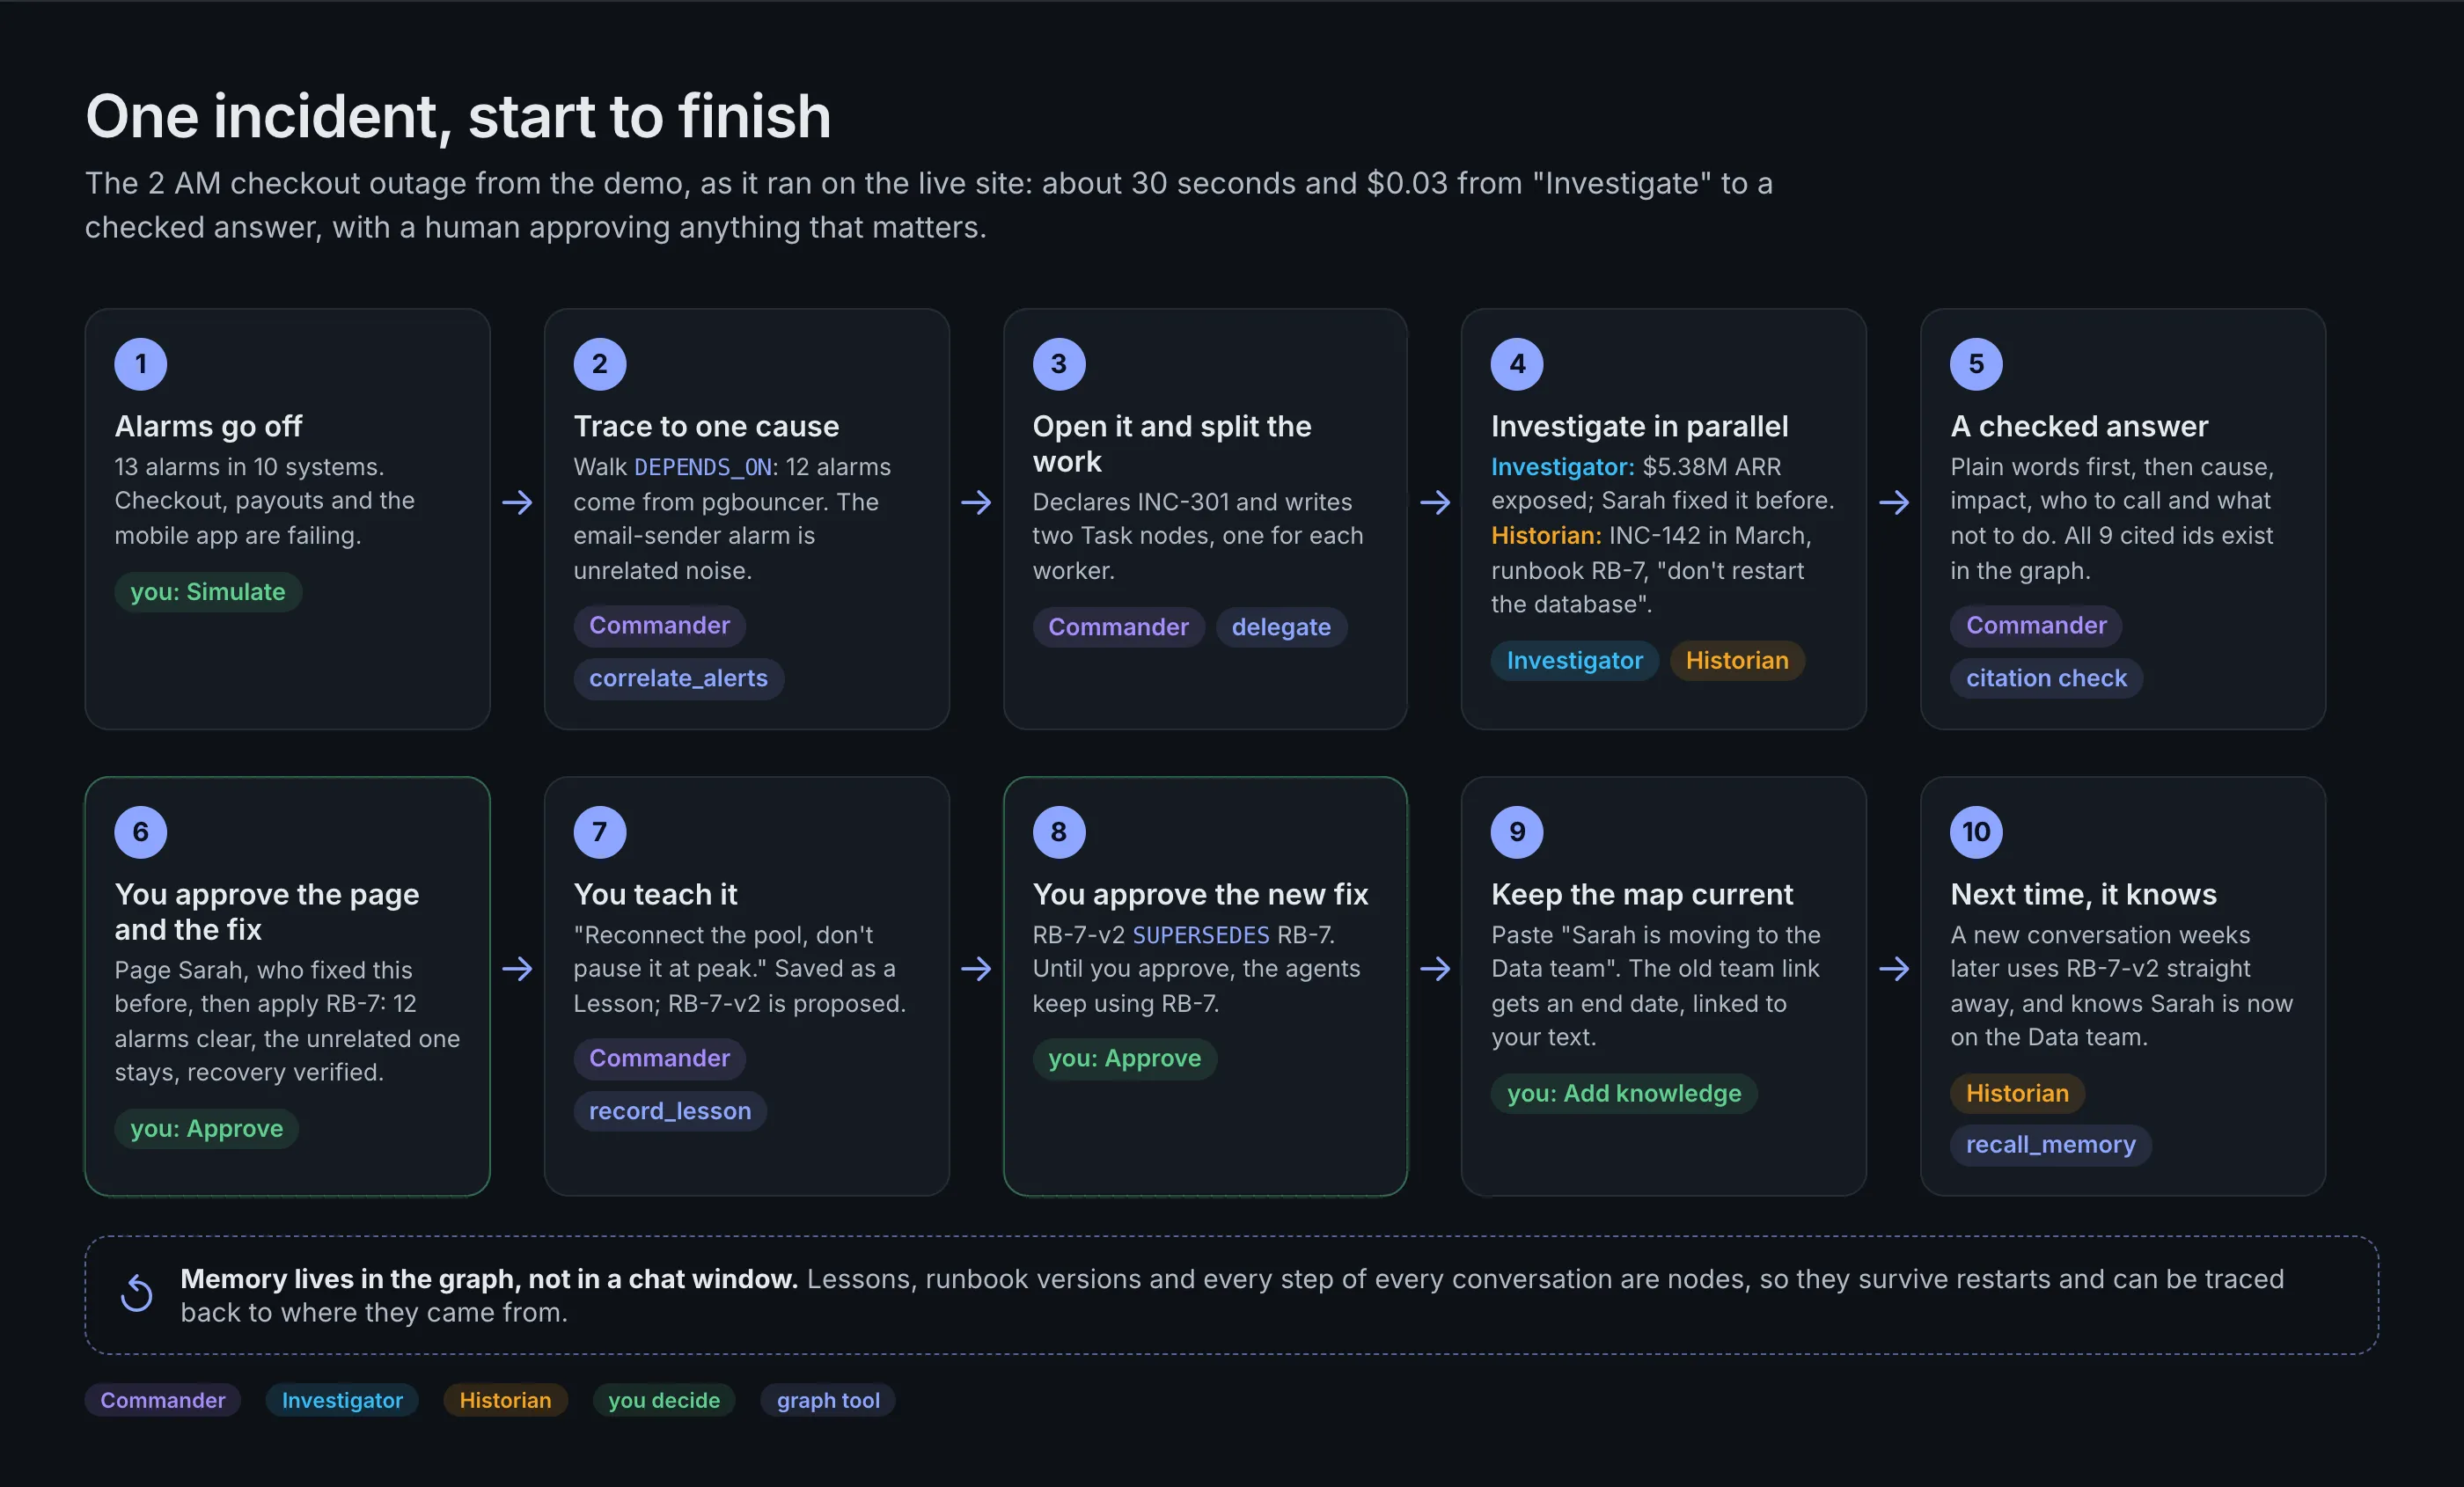 About 30 seconds and $0.03 from Investigate to a checked answer. The green steps are where a human decides.
1. Alarms go off. Simulate incident fires a practice alert storm into your private copy of the graph. It’s free, and nothing is investigated until you press the button.
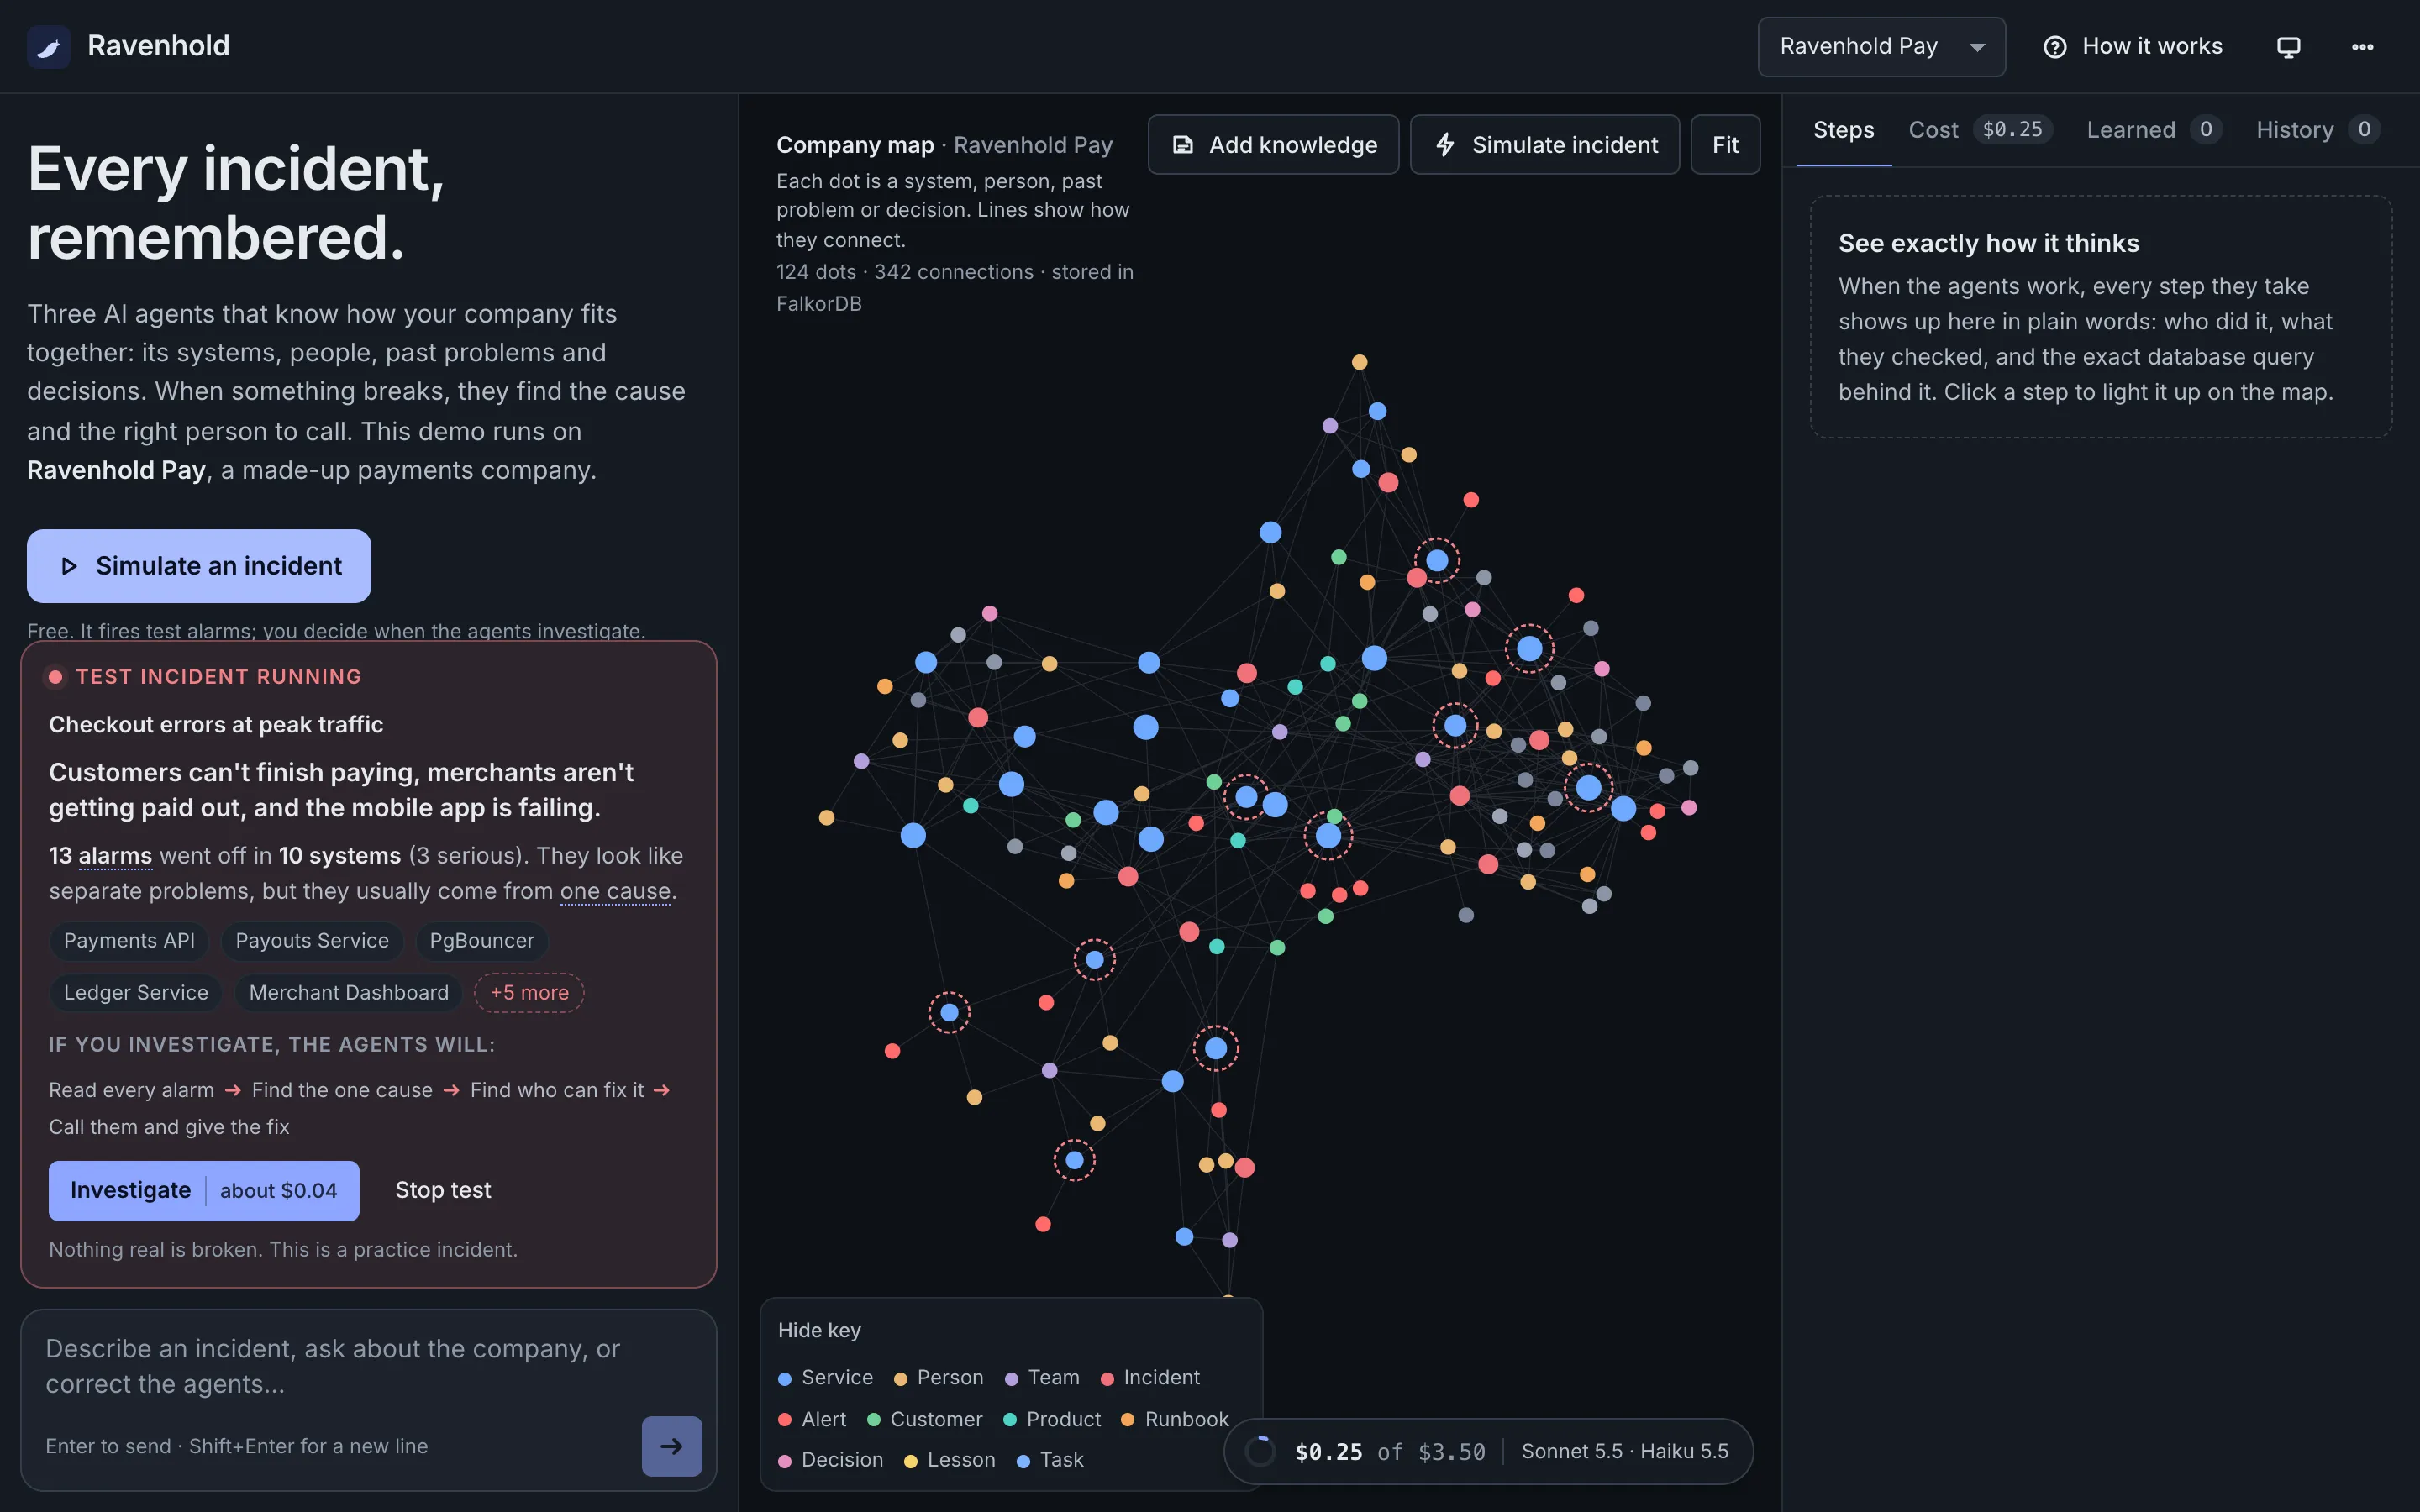 Thirteen alarms in ten systems. The card explains in plain words what the agents will do, and what it will cost, before you spend anything.
2–5. Investigate. The Commander traces the alarms to one cause, opens INC-301 and hands two tasks to the workers. The answer starts with a plain-words summary, then the cause, impact, who to call and what not to do.
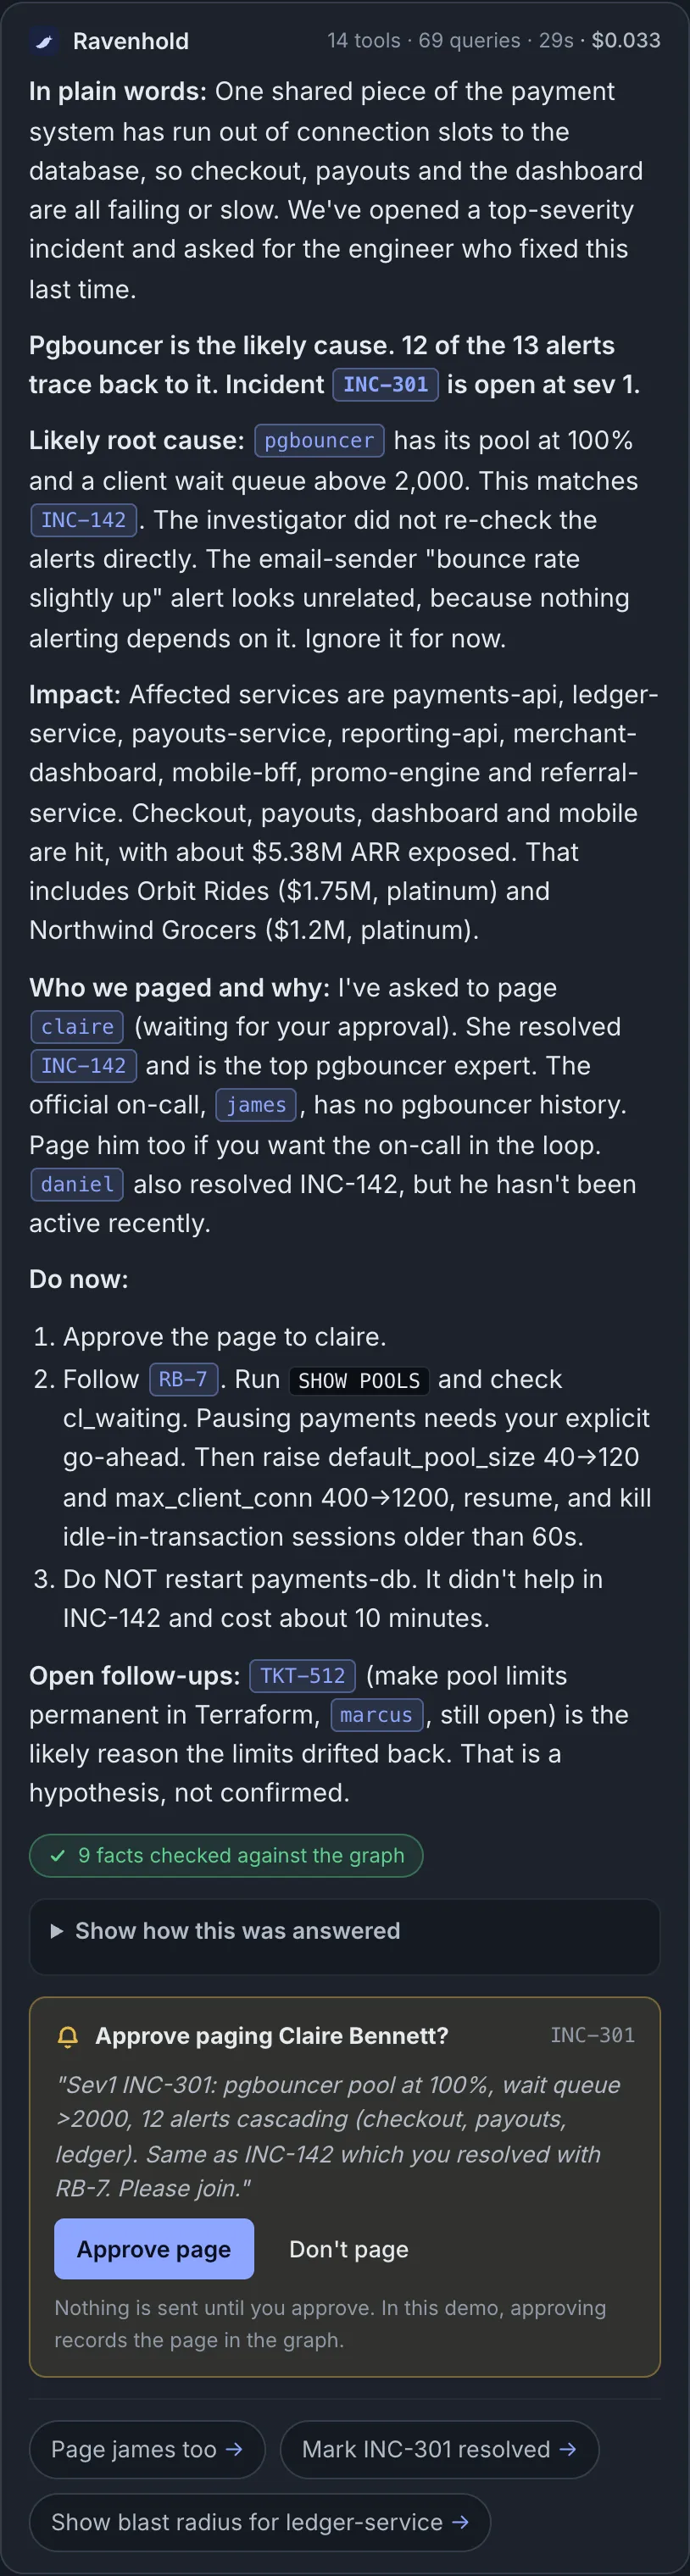 14 tools, 69 queries, 29 seconds, $0.033. Every id in a blue chip was checked against the graph (9 of 9 found), and clicking one flies the map to it.
6. You approve the page. The agents ask; they never page anyone on their own. Note who they picked: Sarah, who fixed this in March and has since moved teams, not just whoever is on call.
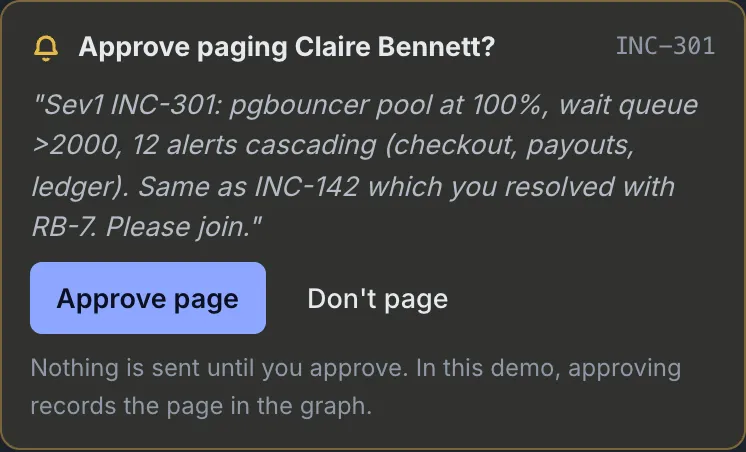 Before: nothing is sent until you approve.
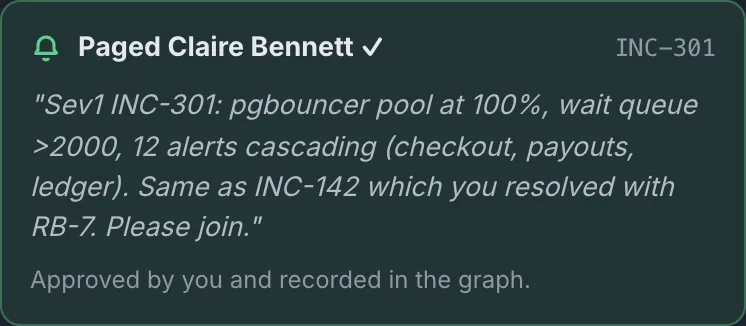 After: the page is recorded in the graph.
7. It fixes it, and checks its own work. Finding the cause isn’t the end. The Commander also proposes the fix:
the latest approved runbook, applied to the root-cause service. Click Apply fix and it is applied to the system
state in the graph: exactly the twelve alarms that PgBouncer explains clear, while the unrelated email-sender alarm
keeps firing, which is the proof that the agent fixed the real cause rather than silencing everything. A
check_recovery tool then verifies recovery from the graph and reports the time to mitigate. Decide, act, verify:
across all three practice storms, it proposed the right fix on the right root service every time.
Seeing the path. Under every answer, Highlight on the map lights up exactly the links the agents walked:
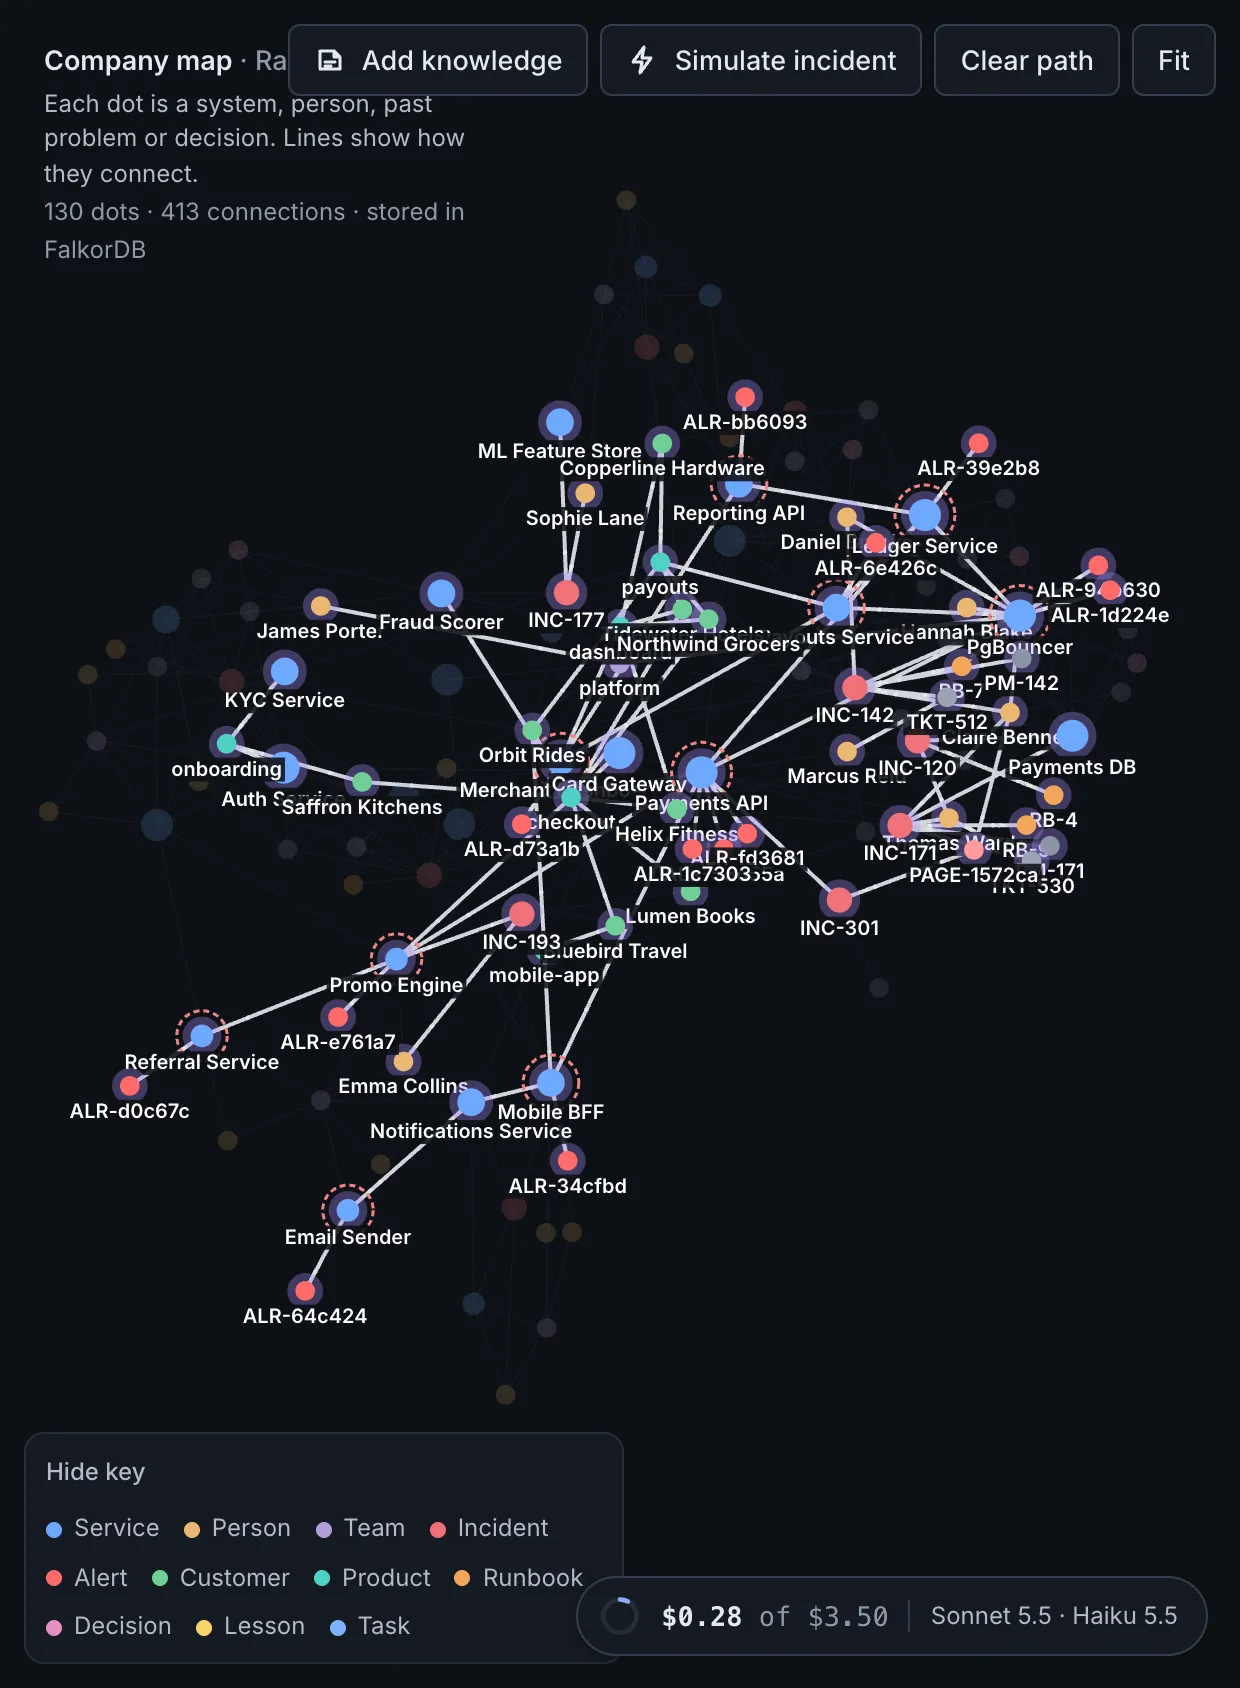 The dependency path the agents followed, from the customer-facing services down to the pool that actually broke.
Using FalkorDB properly
I tried to use what FalkorDB actually offers instead of treating it as a dumb store:
| Feature | What it does in Ravenhold |
|---|---|
Variable-length paths, shortestPath |
blast radius, root-cause candidates, “how are these two connected” |
algo.pageRank, betweenness, harmonic centrality |
“biggest single points of failure” comes from graph algorithms, not LLM opinion |
algo.labelPropagation, WCC |
failure domains: groups of services that tend to fail together |
| Vector index (HNSW, cosine) | similar past incidents, even with different wording |
| Full-text indexes | search across docs, chats, tickets and lessons |
Temporal types (date, duration) |
team history, “active in the last 6 months” |
| Unique constraints | no duplicate incidents or tickets, even under concurrent agents |
GRAPH.COPY |
every visitor gets a private copy of the company in milliseconds |
GRAPH.RO_QUERY + timeouts |
safe ad-hoc queries from the model |
Similar incidents use hybrid retrieval in a single database. Graph proximity (same service, or within 2 hops), full-text score and vector similarity are added together. Embeddings are a tiny local feature-hashing function, so the demo needs no paid embedding API, and any real model can drop in without changing a query.
Memory that you can approve
When you correct the agents (“at peak traffic, reconnect the pool, don’t pause it”), Ravenhold saves a Lesson
linked to the services it applies to. If the correction changes a fix, it proposes a new runbook version
(RB-7-v2) linked to the old one with SUPERSEDES. Agents keep using the current version until a human approves the
new one. Start a brand-new session and the agents use the improved fix straight away.
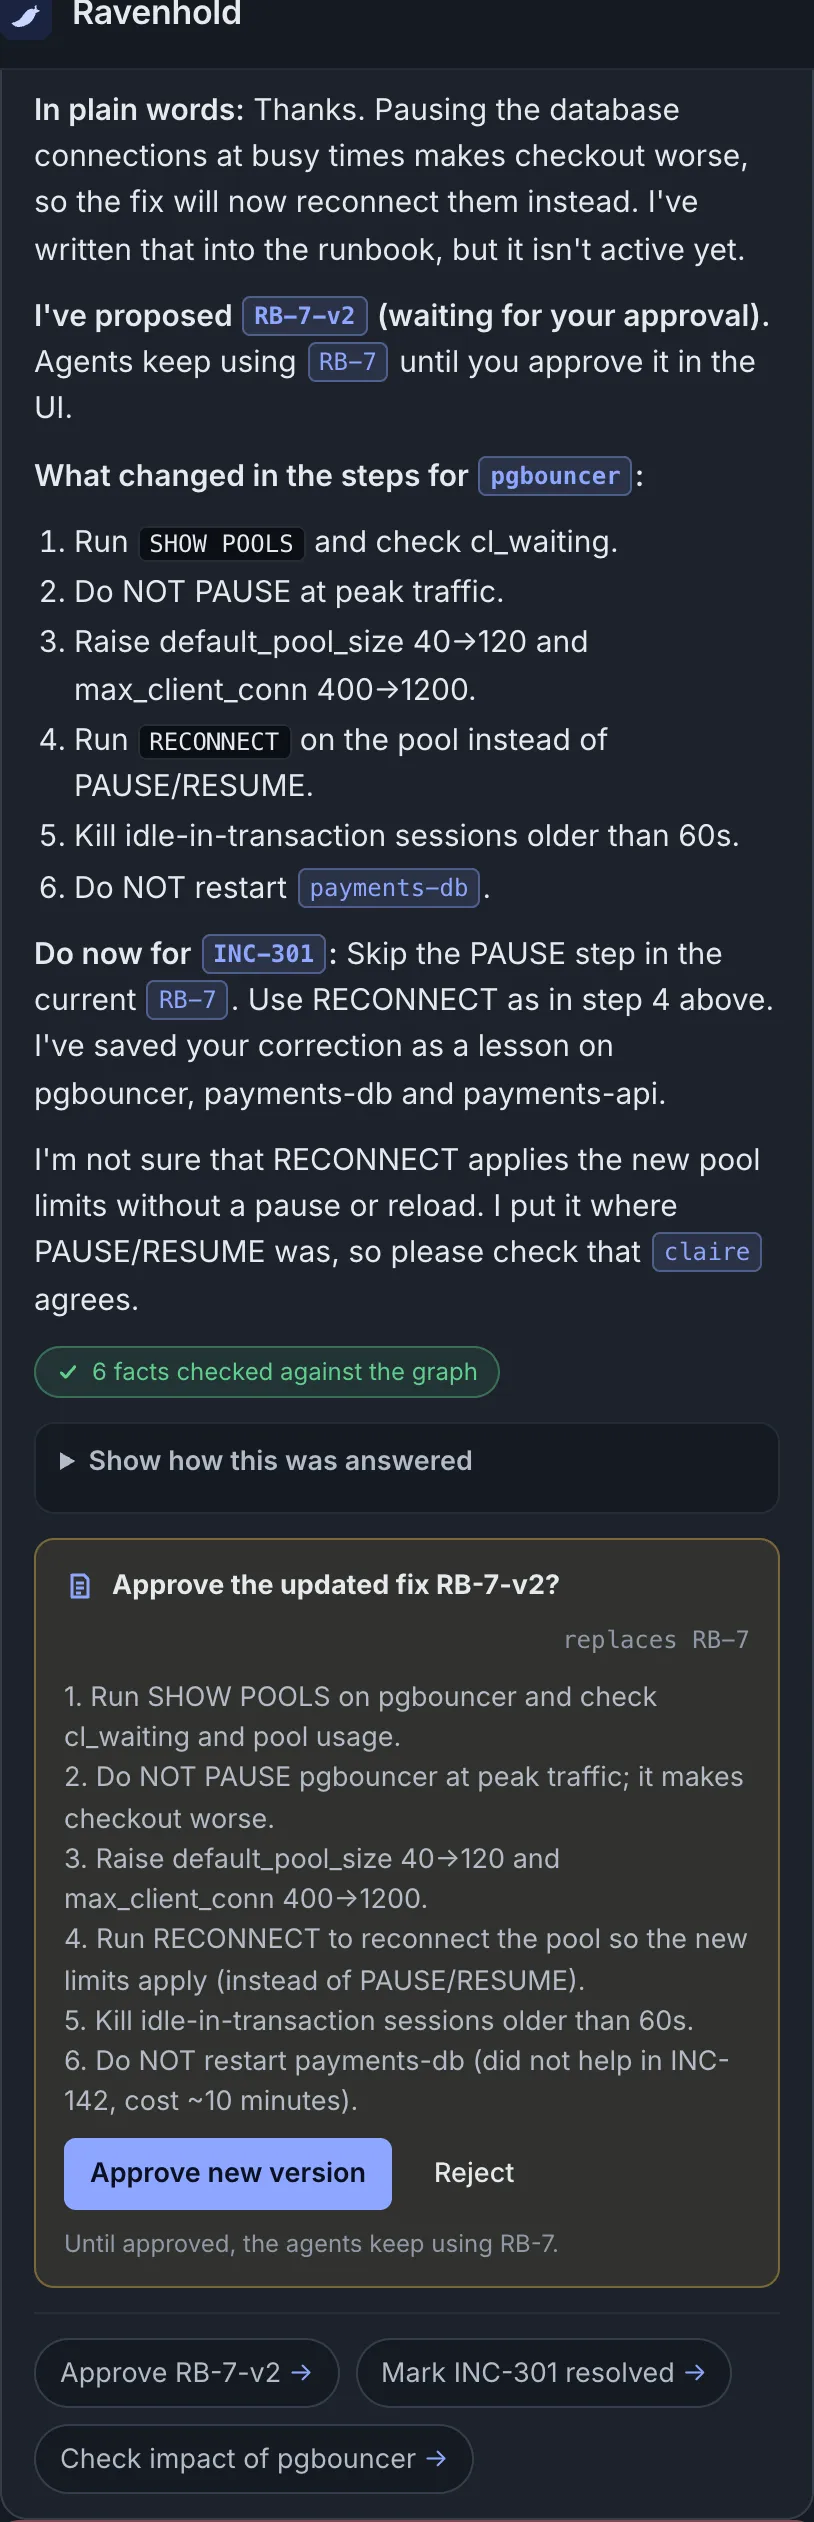 A single correction, written as an ordinary sentence. The agent saves a Lesson and proposes RB-7-v2, listing exactly what changed. Until you approve, everyone keeps using RB-7.
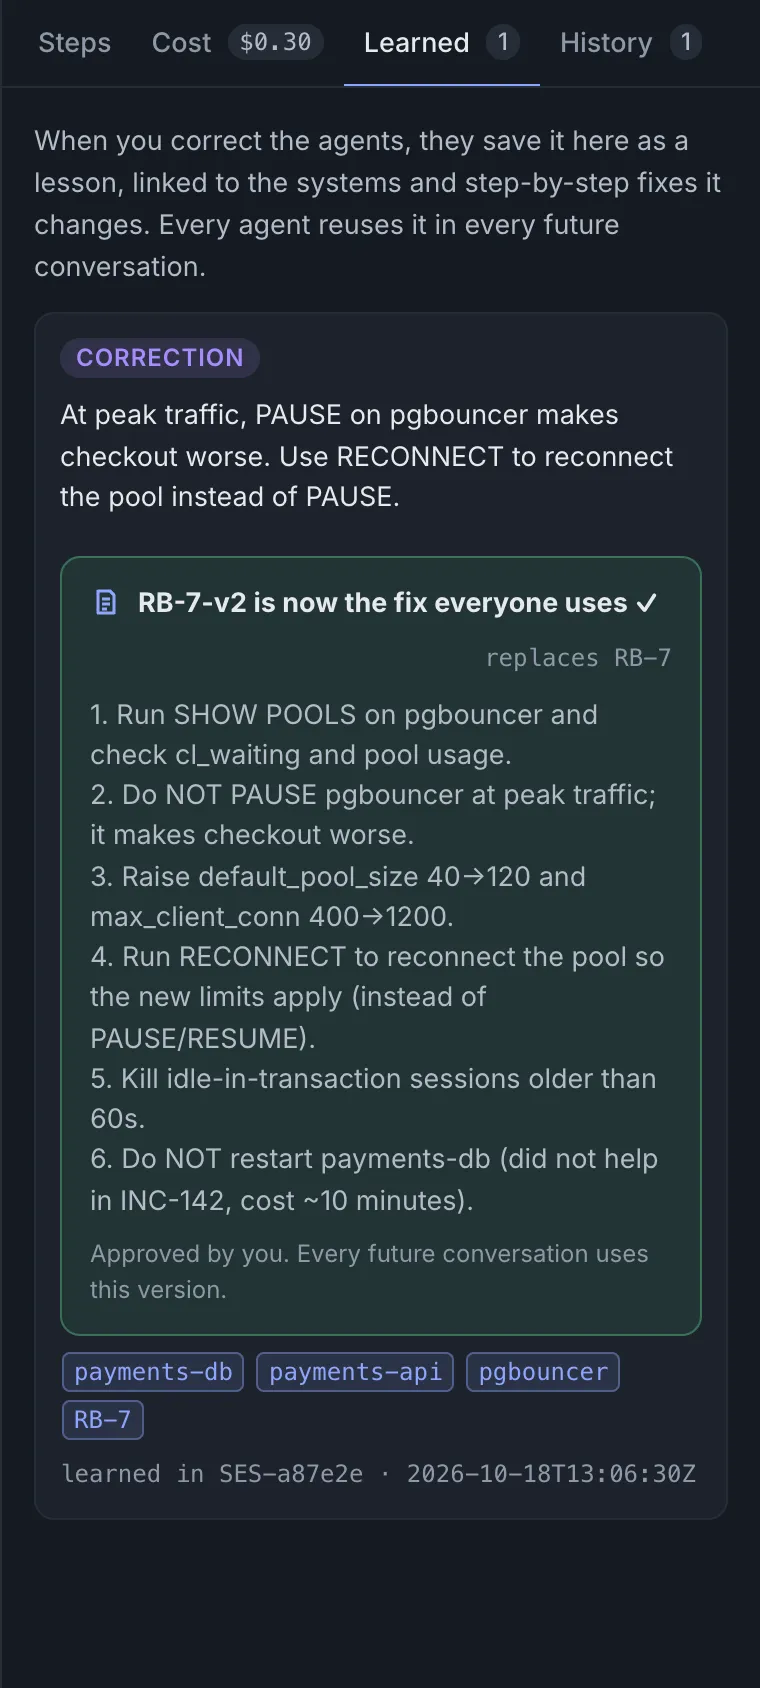 The Learned tab after approval: the lesson, the new runbook version, and the systems it is linked to in the graph.
Paging works the same way: the agent requests a page, and you approve it. Nobody gets woken up by an AI on its own.
Who is working on what
A company brain should know more than systems and incidents, so the graph also has projects: a team OWNS each
one, people LEADS or WORKS_ON it, and it TOUCHES services, IMPLEMENTS decisions, is DOCUMENTED_IN docs, and
tickets are PART_OF it. Ask “What is the Platform team working on, and is anything at risk?” and the Commander
calls project_overview, which works the risks out from the graph rather than from a status field:
- PgBouncer pool hardening is overdue, and its last open ticket, TKT-512, is assigned to Marcus, who has no commits and no incidents on pgbouncer. (He even asked in Slack what the ticket was for.) Sarah, who knows pgbouncer best, isn’t on the project.
- The fraud-features project is waiting on ADR-19, a decision that is still only proposed.
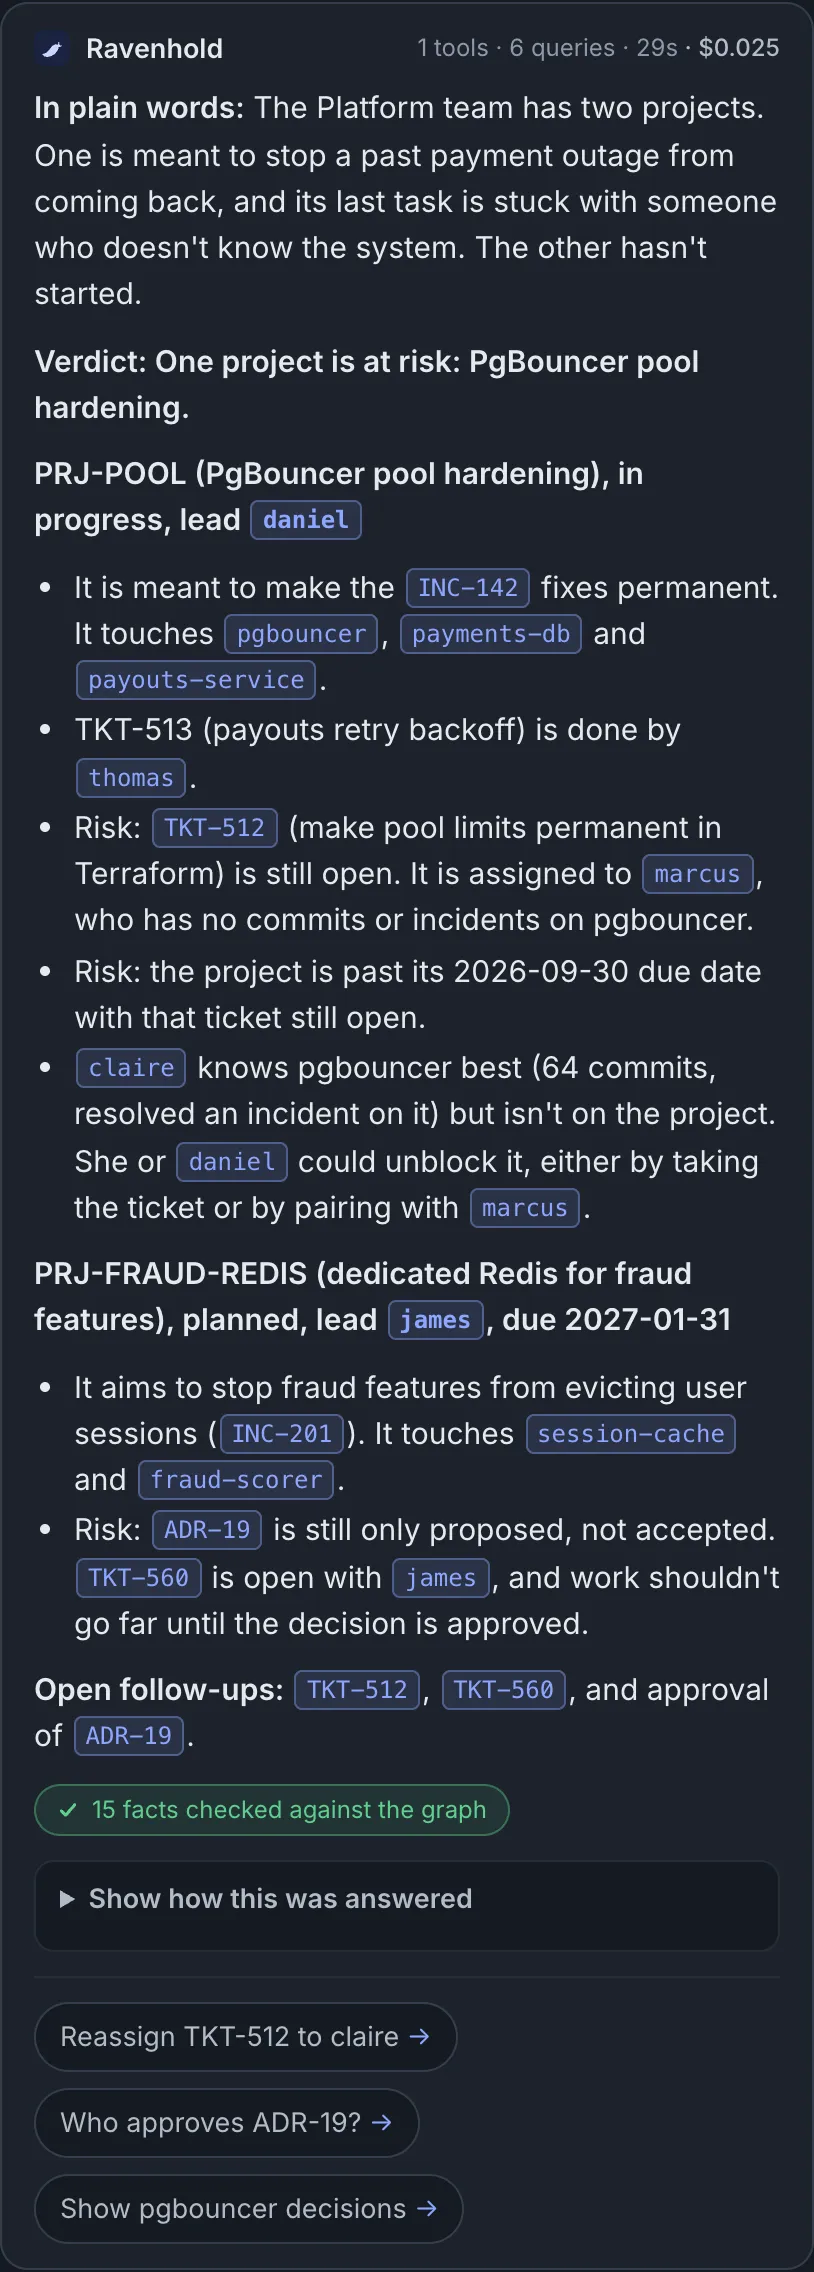 One tool call, 29 seconds, $0.025, and all 15 cited ids checked against the graph. It ends with who can unblock each risk.
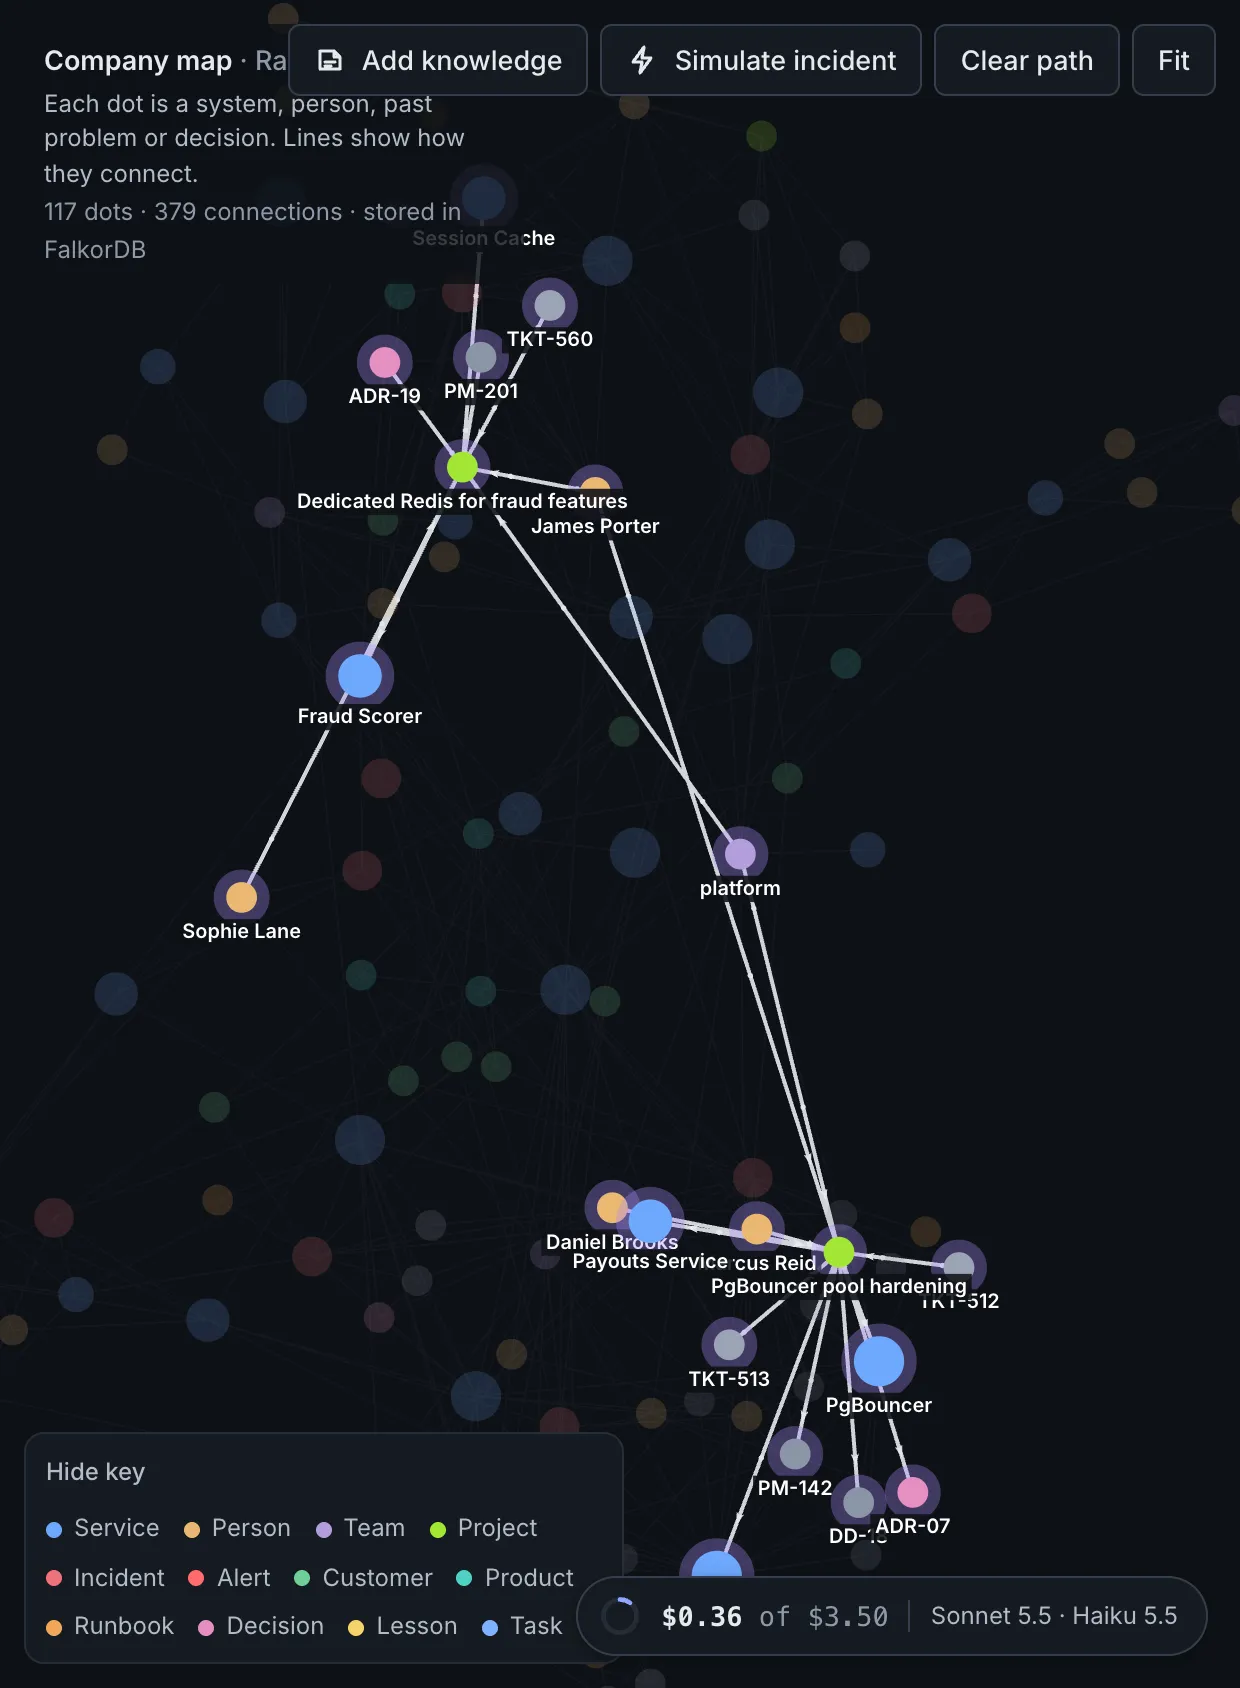 What that one call read: each project with its team, lead, members, tickets, decisions and docs.
Then paste “Sarah takes over TKT-512 and joins the PgBouncer pool hardening project” into Add knowledge, ask again, and that risk is gone, with both changes linked back to the sentence you pasted.
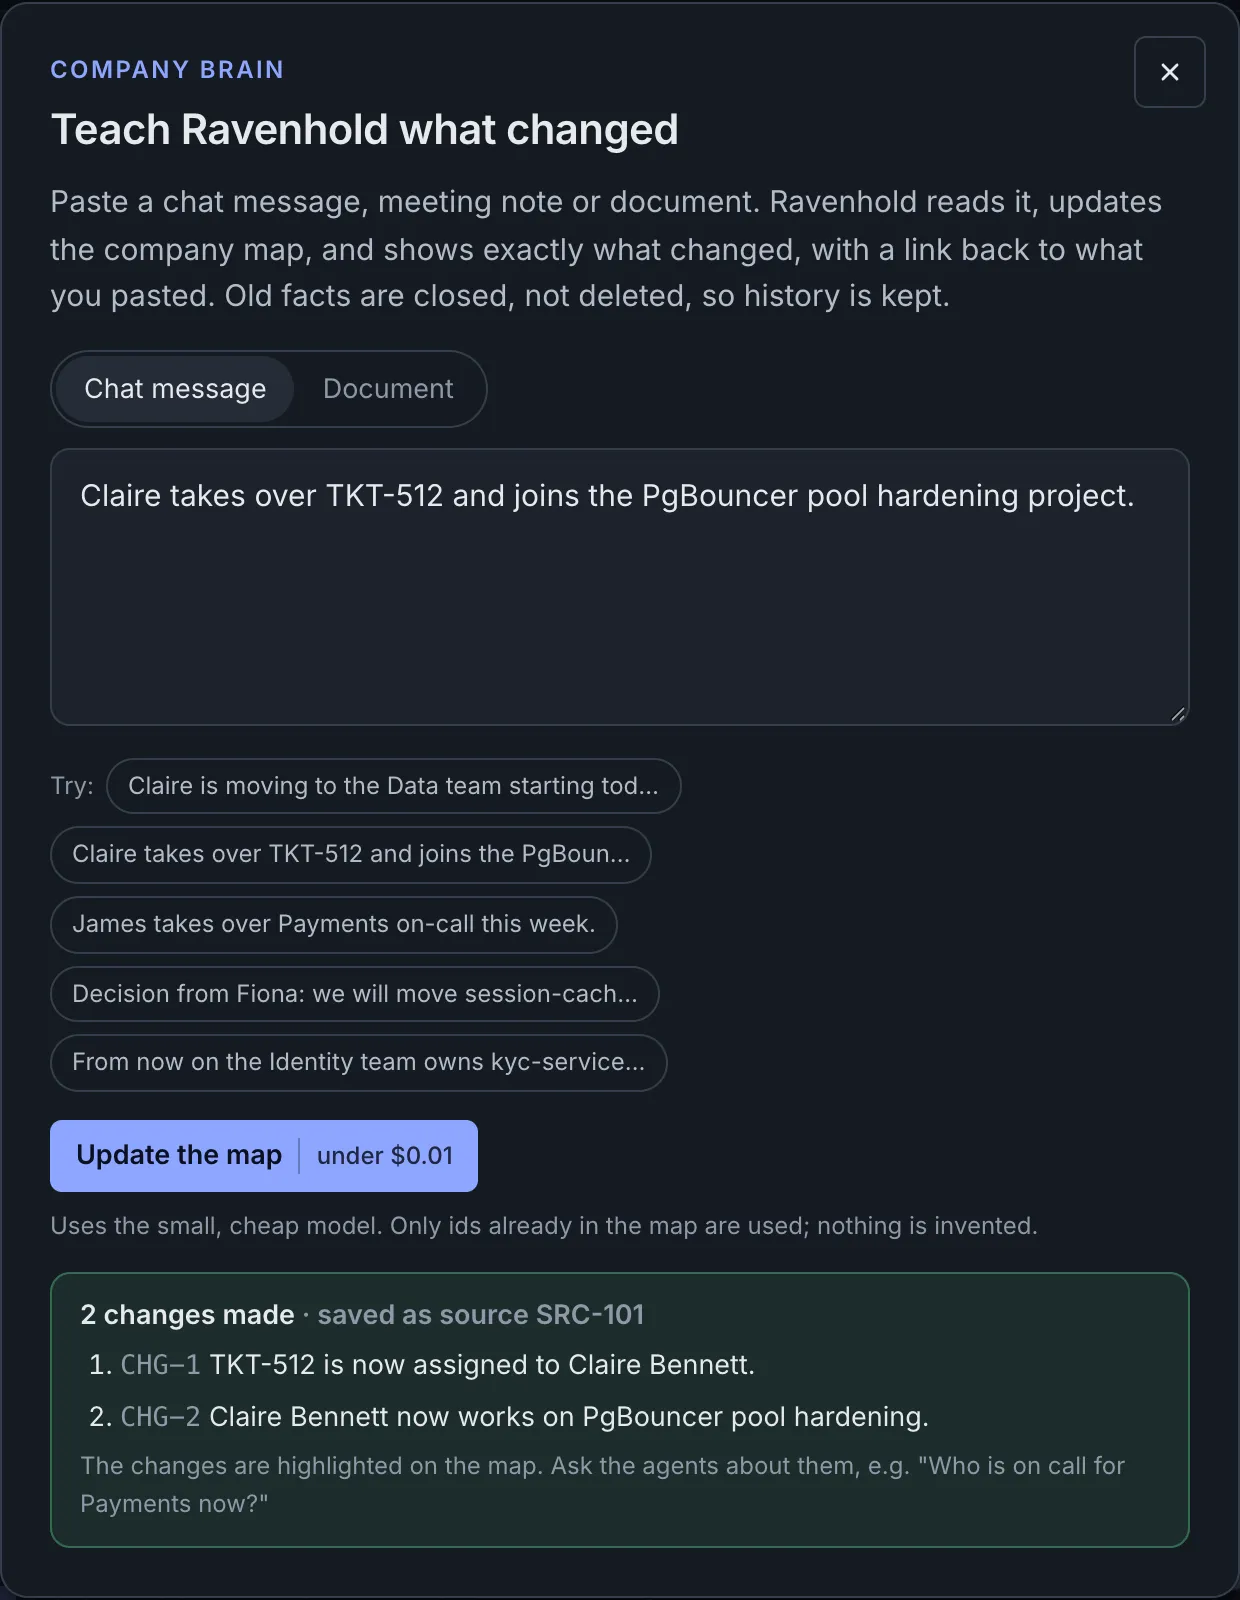 Two changes, each saved with the source it came from.
Keeping the company brain current
Companies change constantly. Paste a chat message like “Sarah is moving to the Data team today; James takes over Payments on-call” into Add knowledge, and Claude Haiku extracts typed facts. The graph then updates:
- the old
MEMBER_OFgets an end date (history kept) and a new one is created; - every update is a
(:Change)node linkedFROM_SOURCEto the text you pasted, so every fact can be traced to where it came from; - ids must already exist in the graph, and anything the model can’t map is skipped, never invented.
Extracting a message costs about $0.0003.
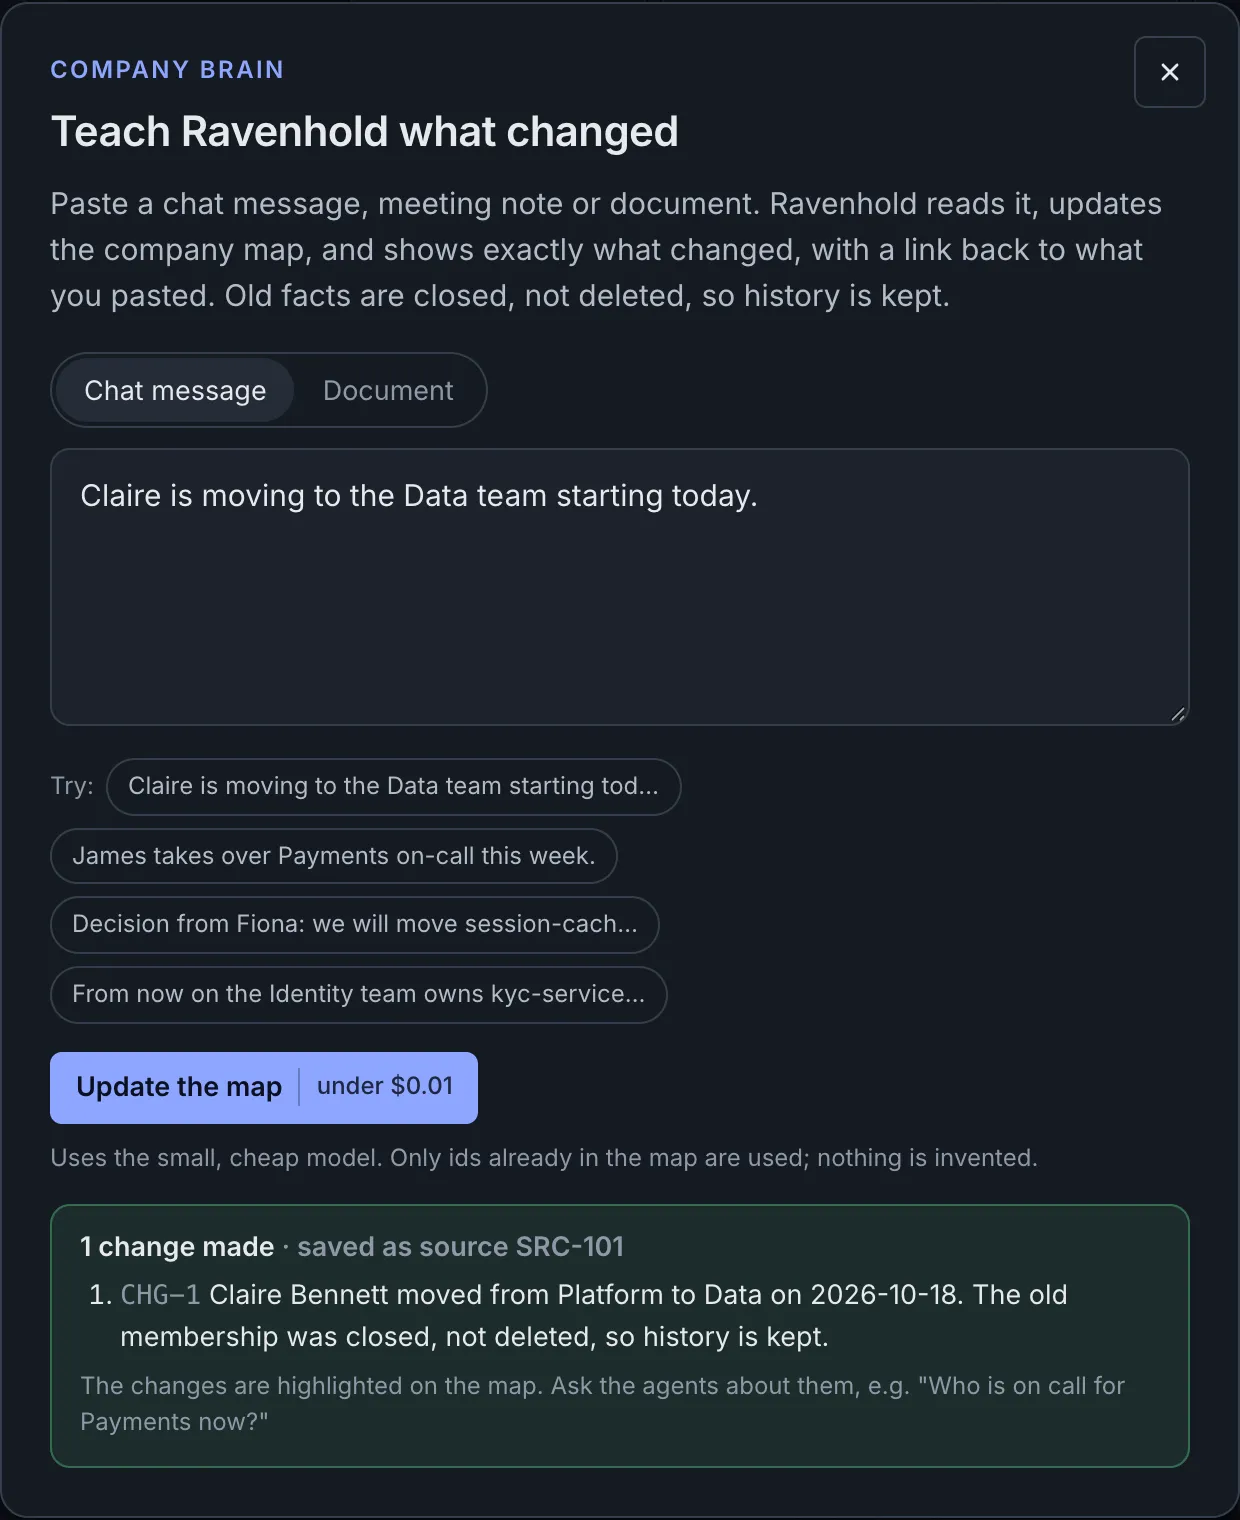 Paste one sentence; get back exactly what changed and the source it was saved under.
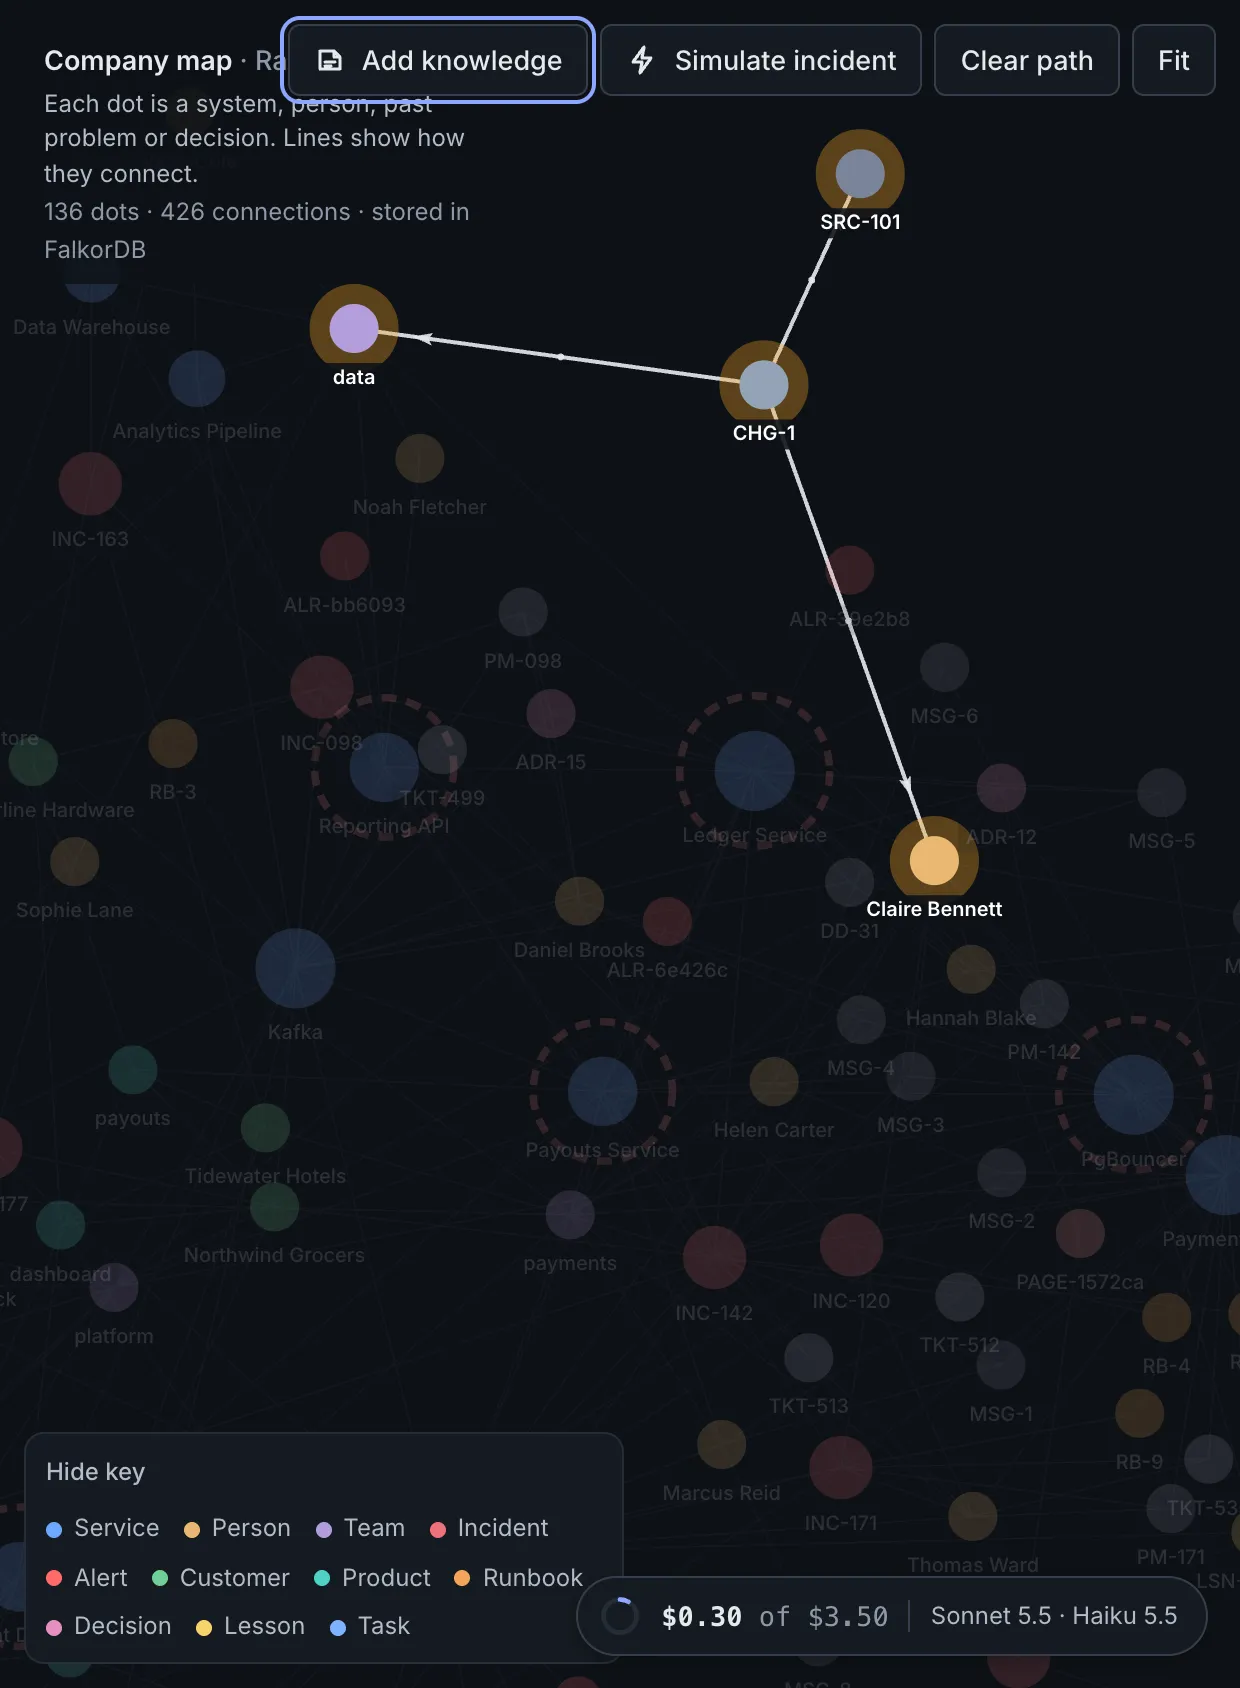 The change, highlighted on the map. The old team link is closed with an end date, not deleted.
Showing its work
I didn’t want “trust me, I’m an AI”, so every answer carries proof:
- Citation check: every
[id]the model cites is looked up in the graph. Anything that doesn’t exist is flagged. - Show how this was answered: under each answer you can open the things it recognised, every tool with its input, output and Cypher, the path through the map (one click highlights it), the models, tokens, cost and time.
- Plain-English steps: each tool result gets a one-sentence explanation written by code, not by an LLM, so non-engineers can follow along.
- Live cost: a small pill on the map shows the running spend, and the Cost tab lists every model call and what it cost.
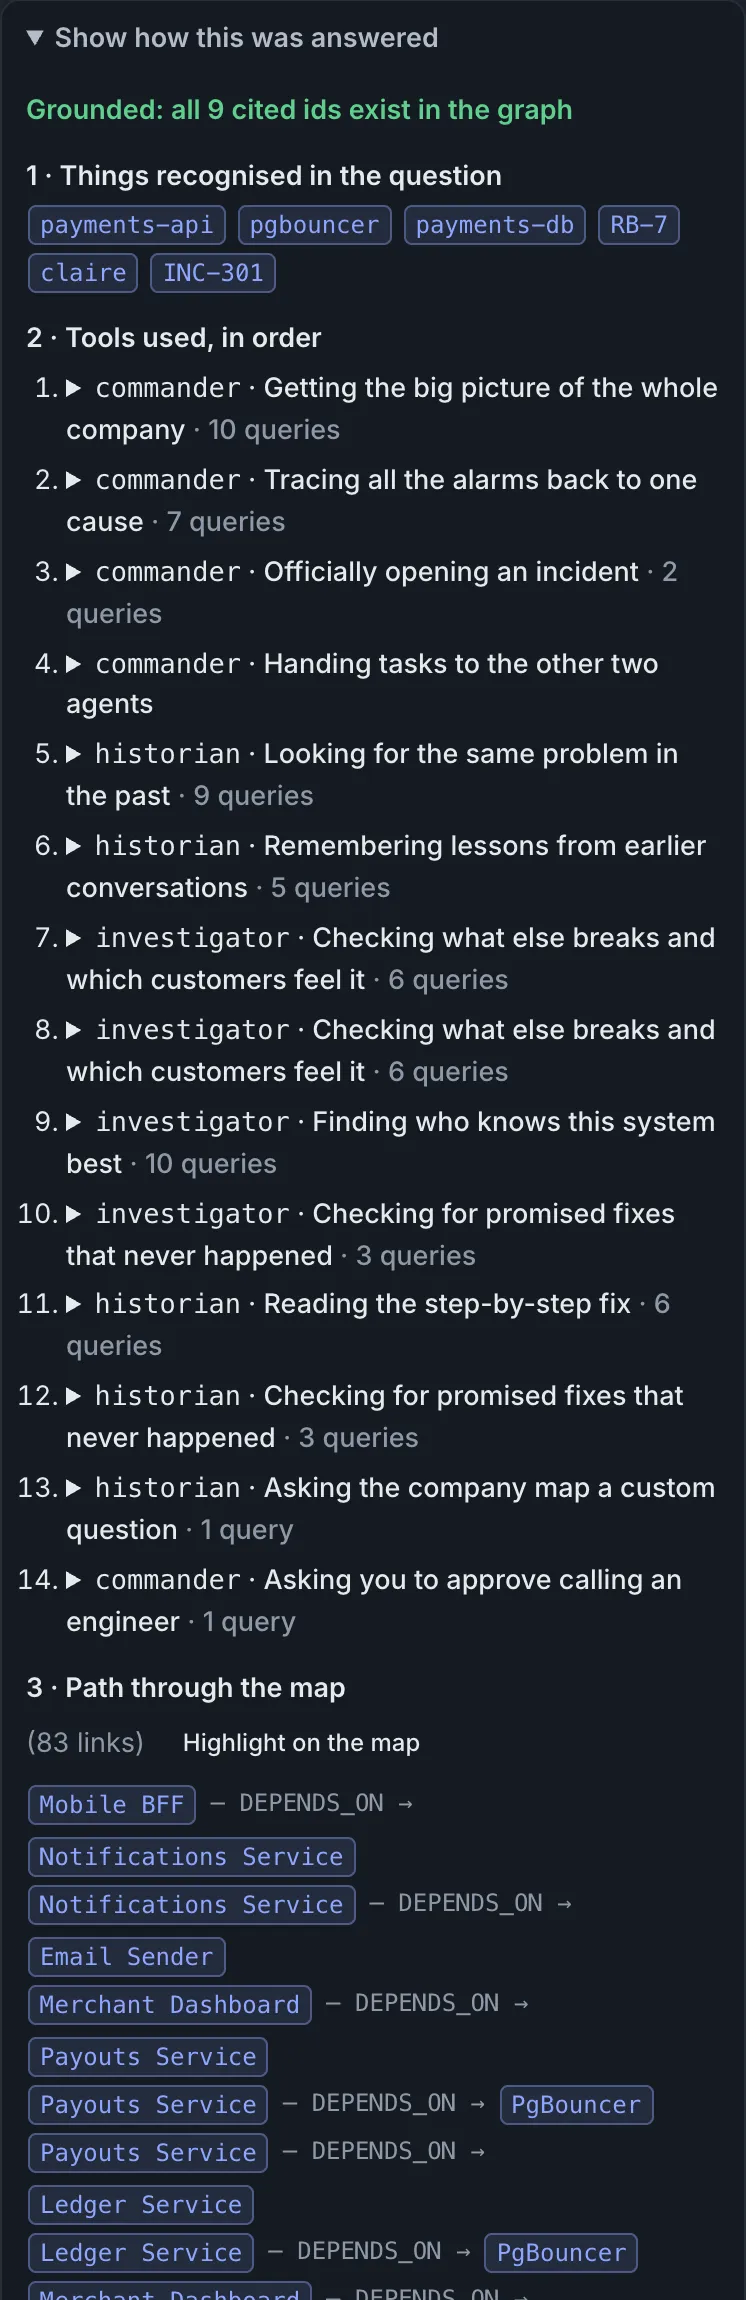 “Show how this was answered” under the incident answer: a grounded flag, the ids it recognised, all 14 tools in order with their query counts, and the 83 links it walked.
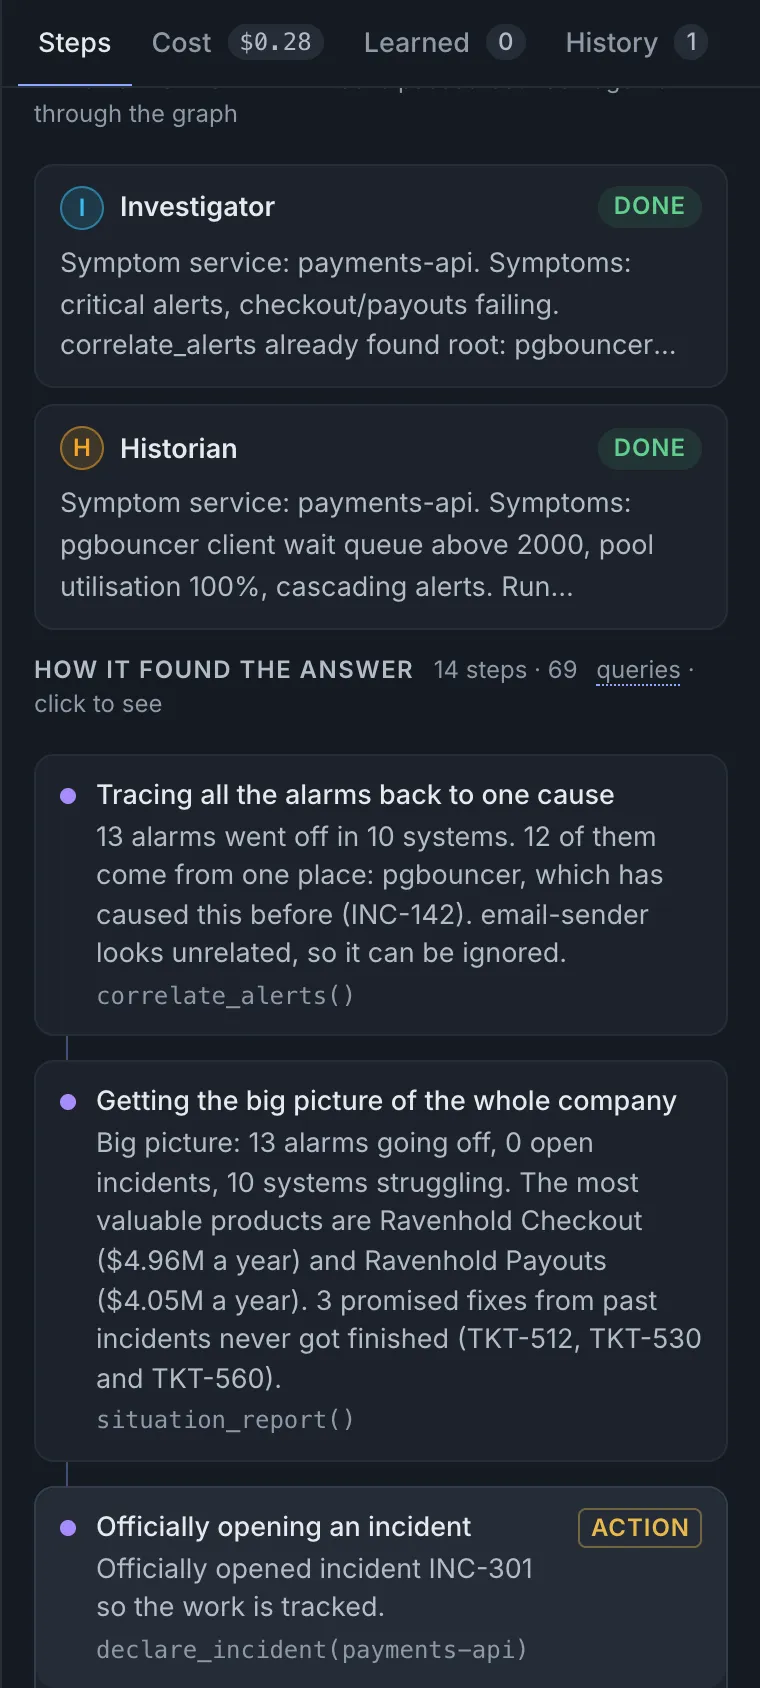 For engineers: open any step to see the exact Cypher it ran and the raw result.
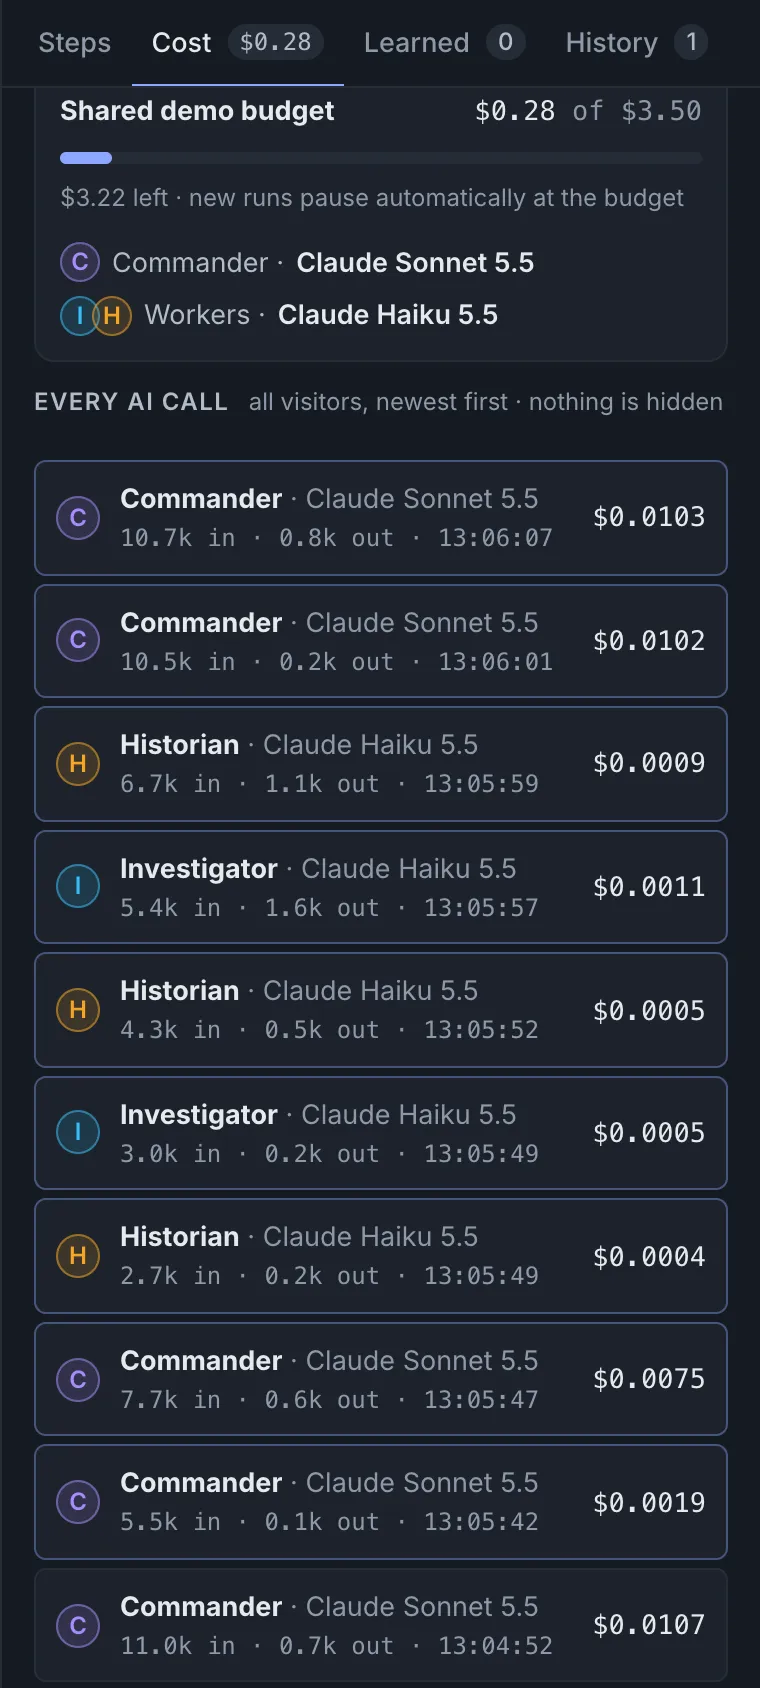 The Cost tab: the shared budget, which model each agent runs on, and every AI call with its tokens and price.
Does it actually work?
- Evaluation: across the 3 alert storms, run 3 times each, Ravenhold named the right root cause 9/9, asked to page the right person 9/9, and called out the unrelated noise alert 9/9. 100% of cited ids were valid. The median time was about 26 s, at about $0.03–0.05 per investigation.
- Preset check: I wrote a script that runs every example question in the UI and compares the tools it actually called with the path I documented. The first run caught a real problem. For “biggest single points of failure”, the Commander skipped the PageRank tool and wrote its own Cypher that just counted dependents. The answer looked fine, but it wasn’t the analysis I claimed. I gave the Commander the dedicated tools directly, and now all seven presets (including the projects question) take the expected path, with every tool call going over MCP. The README lists the one case that still differs and explains why.
- Concurrency: a benchmark runs 100 conversations at the same moment across 5 private visitor graphs, through the same MCP connection and handoff code the agents use: 1,600 graph operations in 3 seconds, no failures, no duplicate ids, and no visitor able to see another’s memory.
- Scale: on generated graphs with 5,000 and 20,000 services, every tool query runs in under 1 s.
- Accuracy per track: a second script asks the real agents track-specific questions and scores them against ground truth from the graph: impact (every affected customer named), memory across sessions (the correction is used in a brand-new conversation and flagged as remembered), projects, experts, decision sources, and 9 pasted updates checked in the graph before and after. Everything passes now; the first run caught two real misses (below).
- 32 automated tests run against a real FalkorDB, with no AI calls.
Things that bit me
GRAPH.COPYunder concurrency. Two visitors arriving at once could hit “could not fork”. The fix was a lock plus retry.- The default
RESULTSET_SIZEis 10,000. At 20k services, an “is this a valid id?” check that loaded every id silently got truncated. The fix was an indexed lookup per id. CASEdoesn’t save you from eager evaluation.date('')inside a CASE branch still threw “Failed to parse date”. The fix was to passnulland letdate(null)be null.- Counting to make ids races. Two agents declaring incidents at once got the same
INC-number. The fix was an atomic counter node (MERGE+SET) plus unique constraints as the backstop. - Check-then-create races. The concurrency benchmark showed that when 20 conversations saved the same lesson at once, it was stored up to 6 times: the duplicate check and the create were separate queries. Folding the check into the create query fixed it, because FalkorDB runs writes to a graph one at a time.
- redis-py 8 raises instead of waiting. Its default pool throws “Too many connections” once 100 are busy. Under load that’s exactly when you don’t want errors, so Ravenhold now uses a blocking pool that waits for a free connection.
- An agent can’t say “I remember” if it doesn’t know which conversation it’s in. The memory evaluation showed the
agents using a lesson from an earlier session but never saying so: they had no way to tell a lesson from last
week from one said a minute ago. Now
recall_memorymarks each lesson as from an earlier conversation or not, and the evaluation passes. - Clean demos lie. My first alert storms were perfectly correlated, so correlation looked trivial. Adding one unrelated noise alert per storm forced proper root-cause attribution (a greedy cover over the dependency graph).
Try it
Open https://ravenhold.onrender.com, press Simulate an incident (free), then Investigate. You get your own private copy of the graph, so you can’t break anything for anyone else. It works on a phone too:
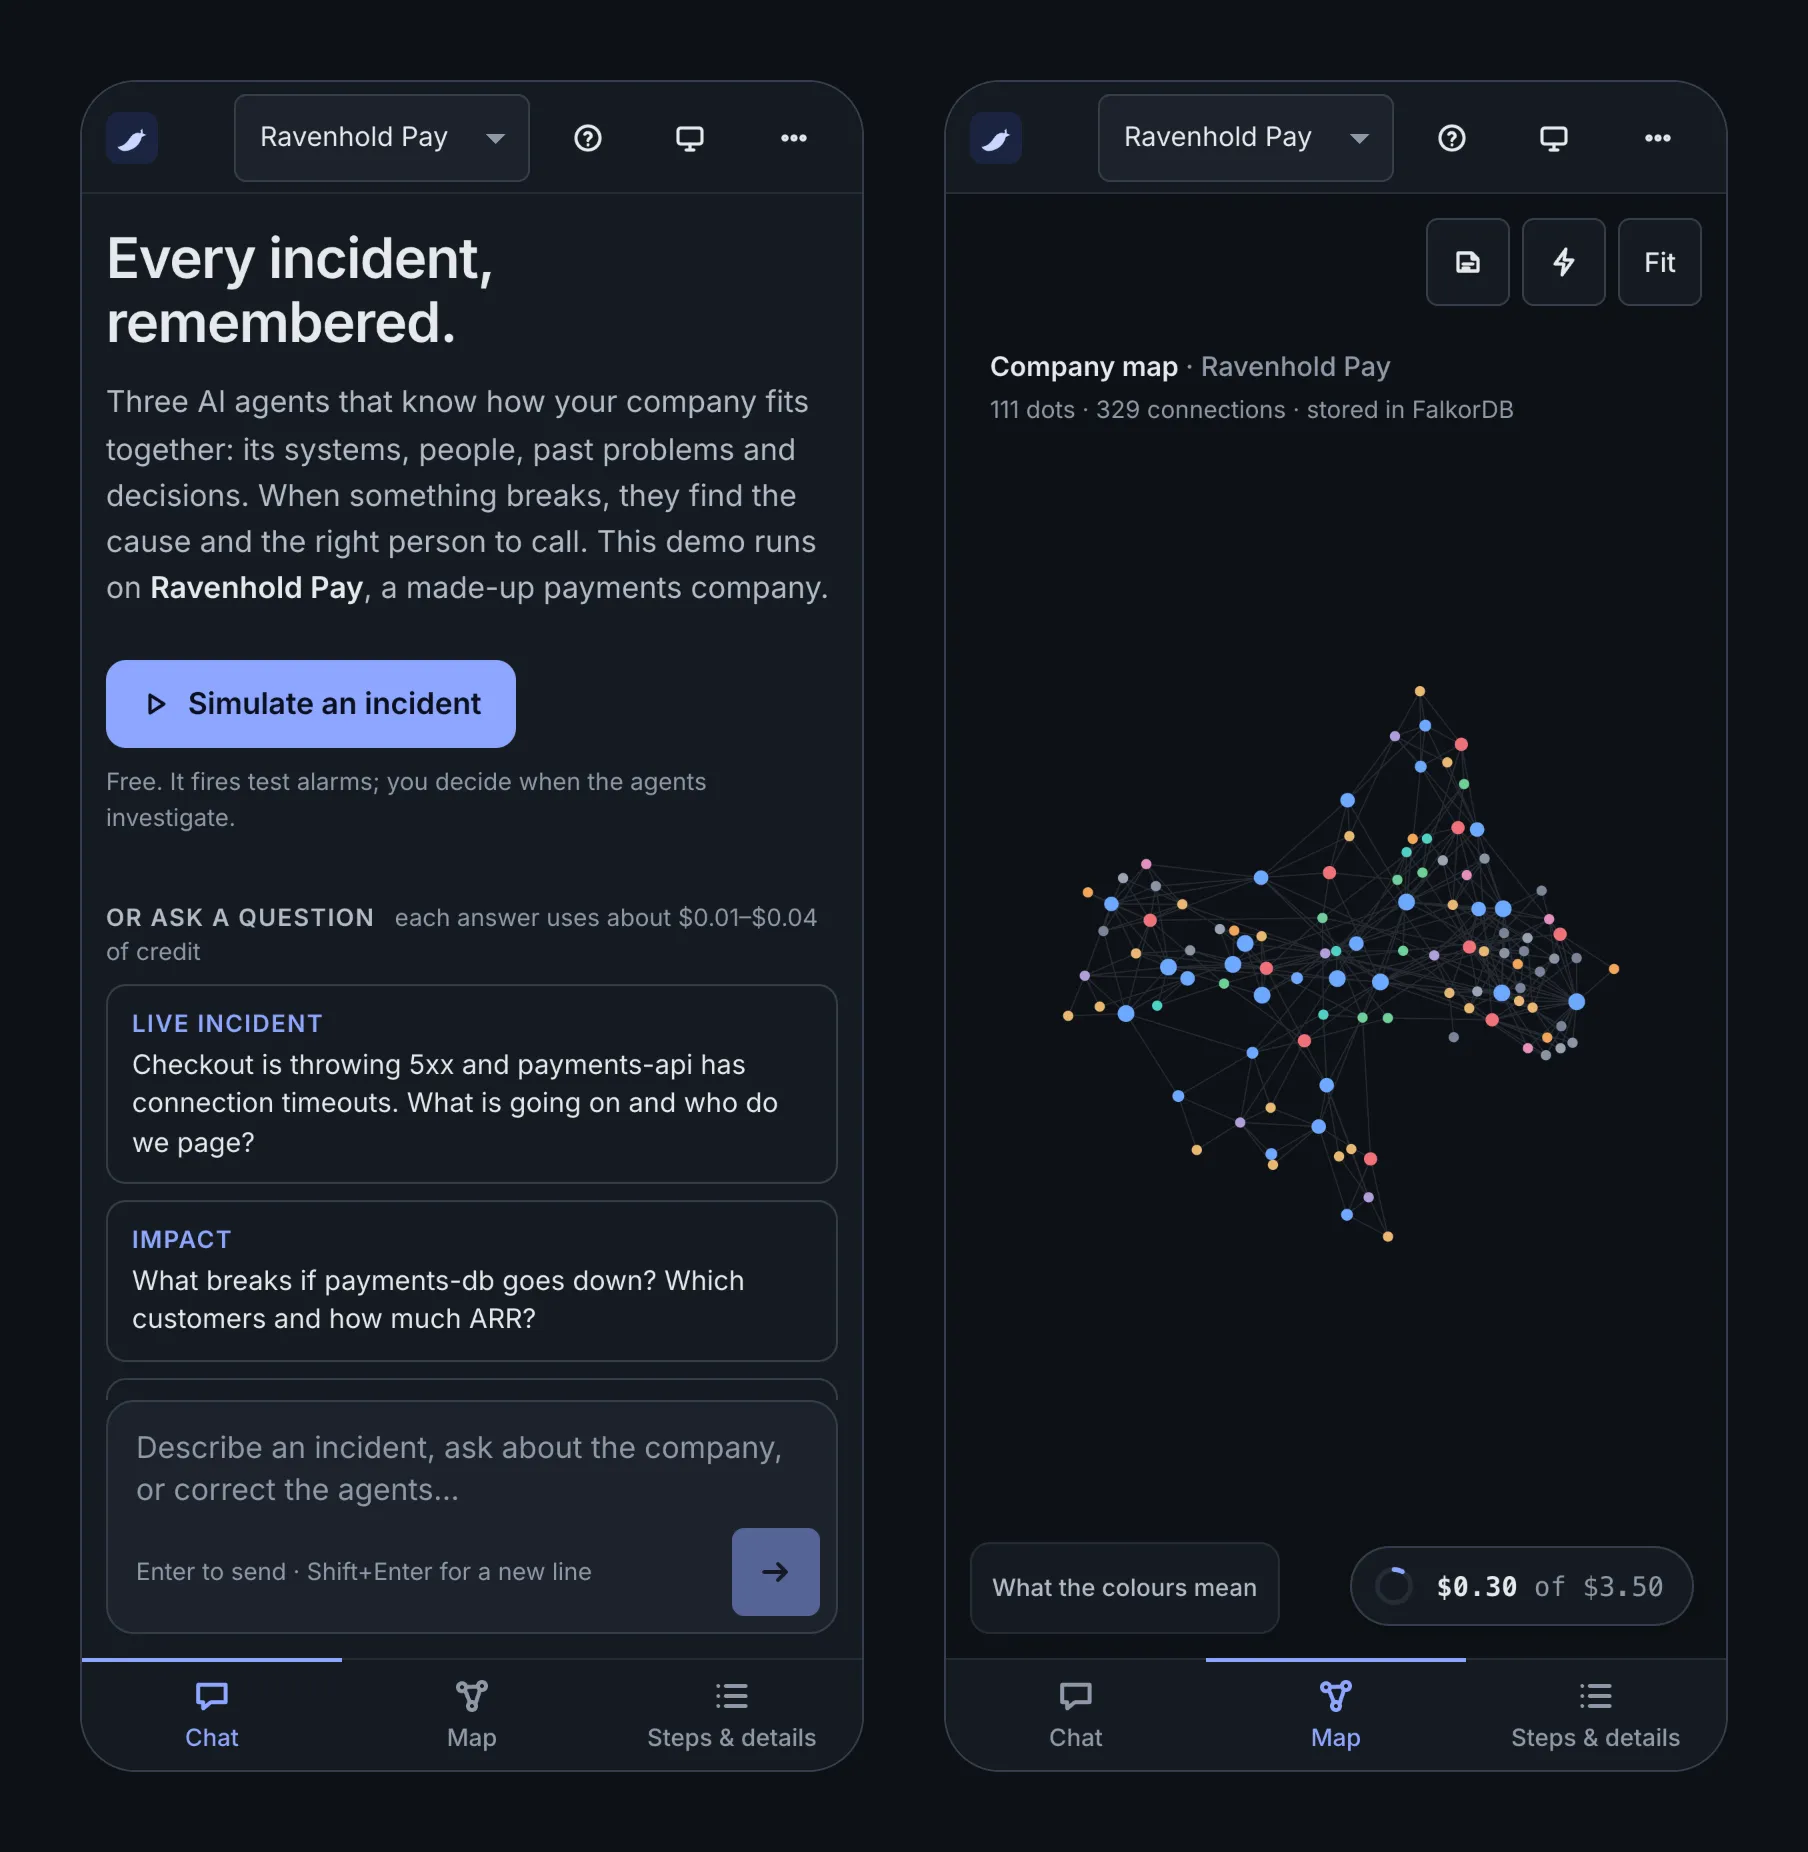 On a phone, Chat, Map and Steps & details are tabs at the bottom.
To run it locally:
docker compose up -d                       # FalkorDB
cd backend && uv run pytest -q             # 23 tests, no API key needed
uv run uvicorn ravenhold.api:app --port 8000
How this was built: I designed Ravenhold, the graph model and the demo scenario, and reviewed and tested every query and agent flow. I used an AI coding assistant, Claude Opus 5.5 via Claude Code, to help write code, Cypher and documentation. The product itself runs on Claude Sonnet 5.5 and Claude Haiku 5.5. All demo data is synthetic.
Built for Graph Hacks by WeMakeDevs × FalkorDB.